Early October 2025 Northern Virginia Real Estate Market Update | No Indication So Far of Increased Buyer Activity from Decline in Mortgage Rates
- Scott Ford

- Oct 9, 2025
- 7 min read
Updated: Oct 13, 2025
How is the Northern Virginia real estate market in early October? Has Buyer activity increased in response to the decline in Mortgage Rates that occurred in expectation of the Federal Reserve's interest rate cut at the September 17th meeting, or the publicity following the cut?
Let's get the answers through a deep dive look at the Buyer Activity Level measured by New Contracts, Days on Market, and the Inventory of Houses for sale.
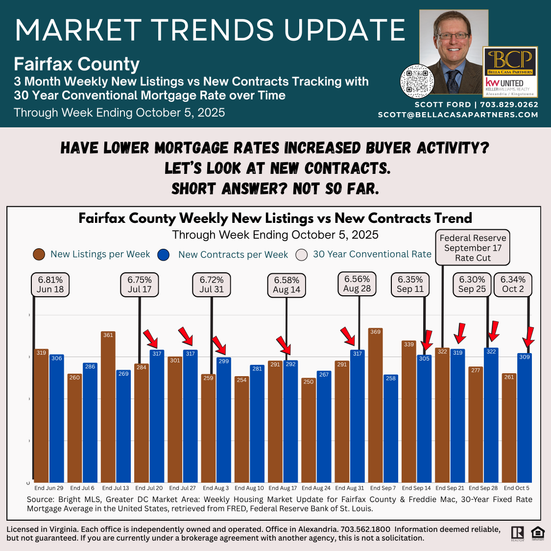
Market Snapshot📷 The data on New Contracts & Showings does not show an increase in Buyer activity responding to the recent Mortgage Rate decline as the market anticipated the Federal Reserve September rate cut. The weekly New Contracts numbers remain in the +/-300 range seen for most of the June to August period. However, New Contracts in Fairfax County increased 26% over 2024 for the week ending October 5th, after being 1-2% lower the prior three weeks. This % increase was not seen in other high volume localities in the Washington Metro area, which were either up slightly or down vs. 2024. However, this % increase is a key item to watch going forward. If a sizeable % increase in New Contracts continues in the next 1-2 weeks, this could be an indication that more Buyers are active (or remaining active) as compared to 2024. Even if we do not see an increase in weekly New Contract numbers compared to +/-300 range over the last three months, an increase in October compared to 2024 would mean a more active late Fall market.
The higher Active Listing Inventory during the Spring and Summer months continued in September (up 34% to 2024 in Fairfax County), which means more options for Buyers, who are taking longer to make a decision on a house than 2024. More options & a longer time to act means continued upward pressure on Days on Market (DoM), which is why we see an increasing DoM over the past months, even as the level of Buying activity through September on par with 2024 in both Fairfax County (down just 7 Contracts over 9 months) & NoVA Market segment (+1.4% over 2024/183 more Contracts).
Buyers currently have more leverage - coupled with Mortgage Rates near the lowest levels over the last 2 years - than they had in 2023 or 2024.
I provide a Market Summary below, but read the full Post for all the details.
Each chart in the Post is also included below for ease of data viewing.


At the start of 2025, I began tracking New Contracts activity in Fairfax County for the first half/second half of each month, with a comparison to 2024 and 2023 Contract activity. This tracking provides real time insight into the Buyer activity trend, especially when compared to the notable increase in Days on Market data as the Spring 2025 market progressed, which continued in Summer into Fall. As the largest market in NoVA, Fairfax County is a good barometer of the Overall NoVa market.
Unless otherwise stated, the numbers below and in the Early October 2025 NoVA Market Update refer to Fairfax County. All data is sourced from Bright MLS or NVAR Historical data.
➡️ New Contracts in 2nd Half of September were up slightly to the 1st Half of September (+7%) and to the same period in September (+5%).
➡️ Total New Contracts in September were basically flat to 2024. Buying activity (measured by New Contracts) in Fairfax County during 2025 through September is on par with to 2024 (just 7 fewer Contracts in 2025). For the NoVA Market segment*, New Contracts were up 1.4% (183 Contracts over 9 months). *NVAR defines the NoVA Market segment as Fairfax & Arlington Counties and the Cities of Alexandria, Falls Church, & Fairfax.
➡️ New Listings in Fairfax County are up slightly in 2025 through August (+4% vs 2024/381 more Listings over 9 months), with New Listings in May through August slightly trailing 2024. In the NoVA Market segment, New Listings through September are up slightly more (+5.5%) over 2024. September had an increase in New Listings in Fairfax County (+17%). The year-over-year New Listings increase in September is something to watch in the October weekly numbers published by Bright MLS to see if the increase continues as a means to assess Seller activity. The more important number to watch is weekly New Contracts vs. New Listings, as this ratio shows the level of Buyer activity relative to total Active House for Sale Inventory.
➡️ Active Listings* for Sale increased across all NoVA localities by a significant % in March through September compared to 2024. Fairfax County had 34% more Active Listings versus August 2024, which follows increases of 62%, 46%, 50%, 40%, & 31% in April through August. *The Active Listing category includes all properties that were Active for Sale during the month. As houses stay on market longer, a house might be an Active Listing for 2-4 consecutive months, whereas the same house in 2024 would list and go under contract within 1 month.
➡️ The DoM numbers show that the Buyers continue to have a lengthy house decision process. The Active for Sale Houses on October 8 in Fairfax County have a Median & Average DoM of 34 & 54 days. The 50% of Houses for Sale above the Median DoM have an average 89 days on market. The overall NoVA Market segment has similar DoM numbers (35/55/93 days). The increase in DoM has stabilized at a high level since early July.
➡️ The DoM numbers for houses going Under Contract in the 2nd Half of September continue to show that a house is taking 2-3 weeks longer to get a Contract than the same period in 2024. The Median DoM for Under Contract Houses during September 16-29 period was 13 days. The Average DoM for a Contract during this period was 28 days. This DoM data - and the DoM data for prior two-week periods - suggests that if a house does not get a Contract during the first two weeks on market, Sellers face a likely potential for the House to wait a further month or longer. For houses that have more than the 1 month Average DoM, the wait for a Contract could be as long as 2+ months.
WHAT'S THE MOST IMPORTANT MARKET NUGGET? 📢🔑
The weekly New Listings vs. New Contracts spread remains the best real-time indicator of the current market. This data is also a potential leading indicator of where the Market may be trending when tracked over time.
WHAT AM I WATCHING IN THE MARKET?🔍👀
New Listings were up during the first two weeks of September, back to a level not seen since early July (+19% & +14% vs. same weeks in 2024). For the first Half of September, New Listings significantly outpaced New Contracts (+26%). However, New Contracts outpaced New Listings during the 2nd Half of the month (+7%). For the entire month, New Listings were slightly above New Contracts (+8.6%). Unless we see New Contracts outpace New Listings in October by a significant market each week, the Active House for Sale Inventory will remain at the current high level.
For the Week ending October 5, New Contracts significantly exceeded New Listings after doing the same the prior week, which is the first time this occurred 2 weeks running since early June. However, the size of the differential, while notable in comparison to prior weeks, is not immediately significant. The differential over two weeks across all property types & price points is less than 100 houses. Keep in mind the weekly Active House number (<$2M, excluding Condos & New Builds) has been mostly in the low- to mid-800 range over the past 3 months. This 2-week differential only reduced the Active House number on October 8 by 41 Houses over two weeks (853 on September 24 - 832 on October 1 - 812 on October 8). So, it seems that we will need a wider differential over a longer period to materially change to current Inventory level. This differential may occur if we see New Listings decline further as we move through October and/or New Contracts pick up from the +/-300 range.
WHAT COMES NEXT? 🙋🏼♂️🤔
Does the current data suggest a different level of Buyer activity for October? Will more Buyers take action now that the Federal Reserve reduced the Fed Funds rate at the September meeting, with the expectation that further reductions will occur at the October and December meetings?
Mortgage Rates have moved sharply lower since mid-August in advance of the Federal Reserve's expected rate cut plans at the September meeting. We are near 2-year lows in the 30 Year Conventional & VA Fixed rates. However, the decline in Mortgage Rates has not - so far - caused more Buyers to act by putting houses Under Contract in September. The weekly Under Contract totals for September and the first week of October are either below or in line with the totals seen over the prior three months (i.e., at/near 300 New Contracts each week). Neither is there an increase in Showings that is obviously tied to more Active Buyers, rather than Buyers having more Houses they can look at with less time pressure to act. The weekly Showings numbers for September and early October are within a range seen during July and August.
We know that Buyers have more houses to choose from with the current higher Inventory level. More choices means a market environment where Buyers have more leverage than we have seen during the past two years. I see nothing in the current data that suggests that the high DoM level we currently have will abate, nor is the high House for Sale Inventory level likely to decline in October unless we get a substantial "overage" of New Contracts vs. New Listings prompted by the the current lower mortgage rates. At present, we are just under 2 months of Inventory in the NoVA market, which is double the level seen in the last 5 years. Our market has been locked in a 1 month inventory range for so long that a 2 month supply of Inventory “feels” & “acts” like a Balanced Market.


For for my prior Market Update posts May through July, check out the following links:
See more market news, insight, & analysis on my "How's the Market?" Blog at bellacasapartners.com/marketnews.


Comments