Mid-February 2026 Northern Virginia Real Estate Market Update | 2026 Begins with Higher Inventory Level & a 'Divided' Market as Buyers Focus on Newly Listed Houses vs. 'Stale' Houses from 2025
- Scott Ford

- Feb 20
- 5 min read
Updated: Mar 4
How is the Northern Virginia real estate market in mid-February 2026?
What does the current Market data tell us about the 2026 Spring Market?
Let's get the answers through a deep dive look at the Buyer Activity Level measured by New Contracts, Days on Market, and the Inventory of Houses for Sale.
I provide a Market Summary below the Post, but read the full Post for all the details and charts.
Each chart in the Post is also included below for ease of data viewing.


📷 MARKET SNAPSHOT IN MID-FEBRUARY 2026
At the start of 2025, I began tracking New Contracts activity in Fairfax County on a weekly and first half/second half of each month basis, with a comparison to 2024 and 2023 Contract activity. New Listings & Total Active House for Sale Inventory are also tracked on a weekly basis. This tracking provides real time insight into the Buyer activity trend, especially when compared to the notable increase in Days on Market (DoM) throughout 2025. As the largest market in NoVA, Fairfax County is a good barometer of the Overall NoVa market.
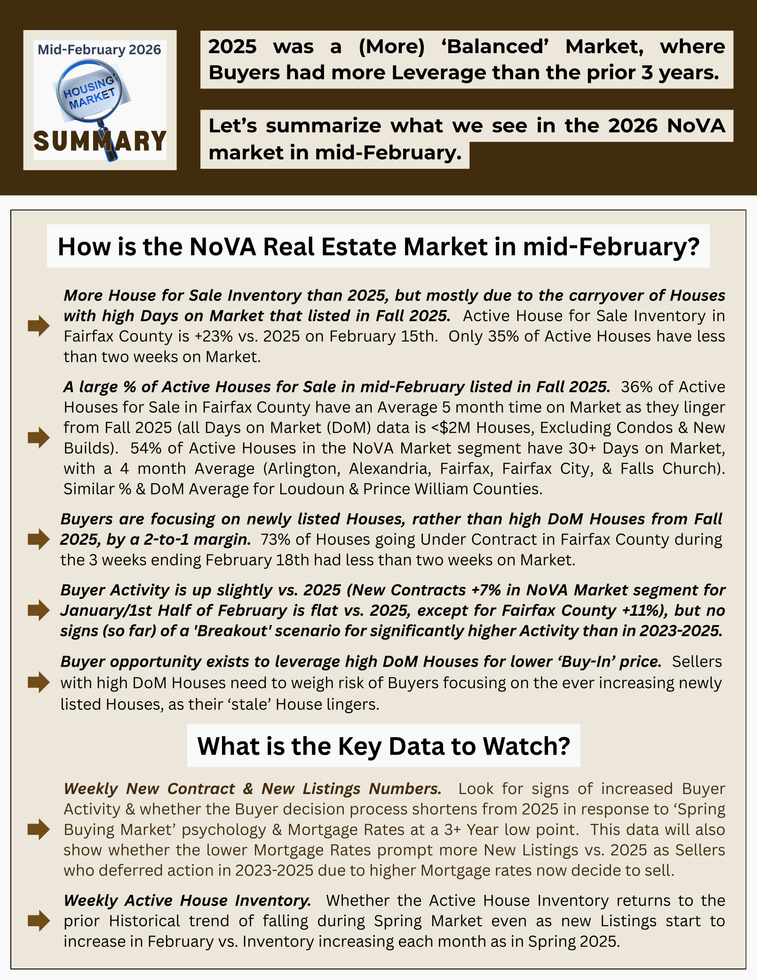
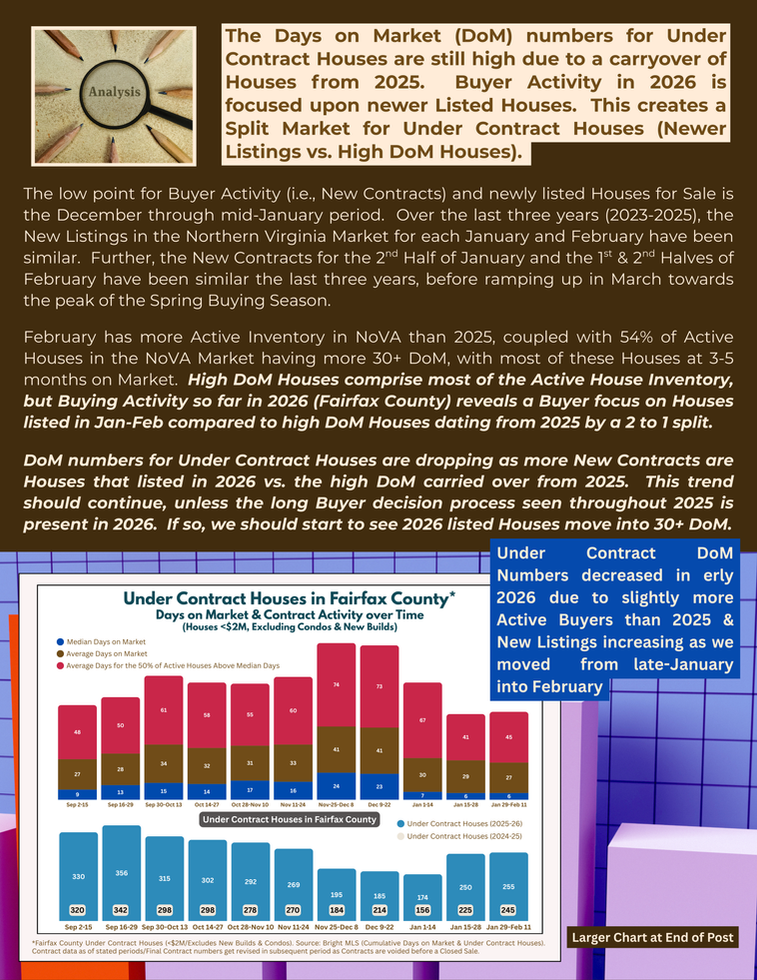
More House for Sale Inventory than 2025, but mostly due to the carryover of Houses with high Days on Market that listed in Fall 2025.
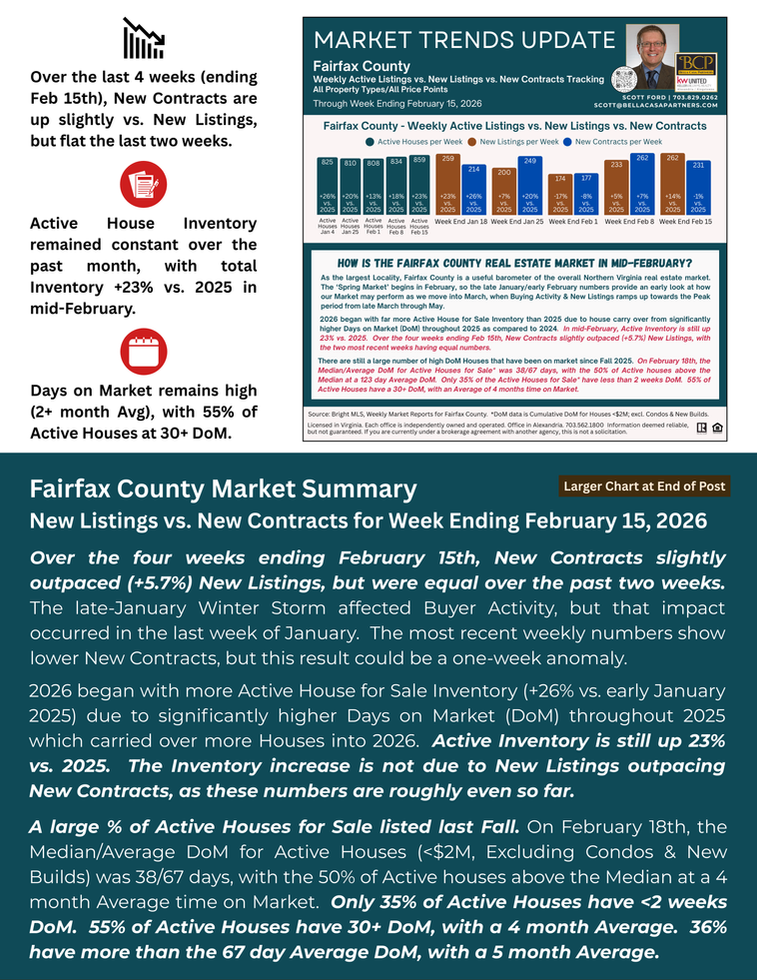
➡️ Active House for Sale Inventory in Fairfax County is up 23% vs. 2025 for the Week Ending February 15th. 2026 started with 26% more Inventory.
➡️ Weekly New Listings in Fairfax County are up slightly vs. 2025 during the late-January through mid-February period. Over the four weeks ending February 15th, New Contracts in Fairfax County slightly outpaced (+5.7%) New Listings, but were equal over the past two weeks.
➡️ The other NoVA Localities (e.g., Alexandria, Arlington, Prince William, & Stafford) each have significant % Inventory increases vs. 2025, with the exception of Loudoun County, which is flat vs. 2025 (for the Week Ending February 15th).
Buyer Activity measured by New Contracts is up (slightly) vs. 2025, but no signs (so far) of a 'Breakout' scenario for significantly higher Activity than the last three years.
➡️ New Contracts in Fairfax in 1st Half of February were up 11% vs. 2025, after being flat in 2nd Half of January, as late-January Winter weather reduced Buyer Activity. New Contracts in the other NoVA Localities are flat vs. 2025 over the 1st Half of February.
➡️ New Contracts were up 7% vs. 2025 during January for the NoVA Market segment.
A large % of Active Houses for Sale in mid-February listed in Fall 2025.
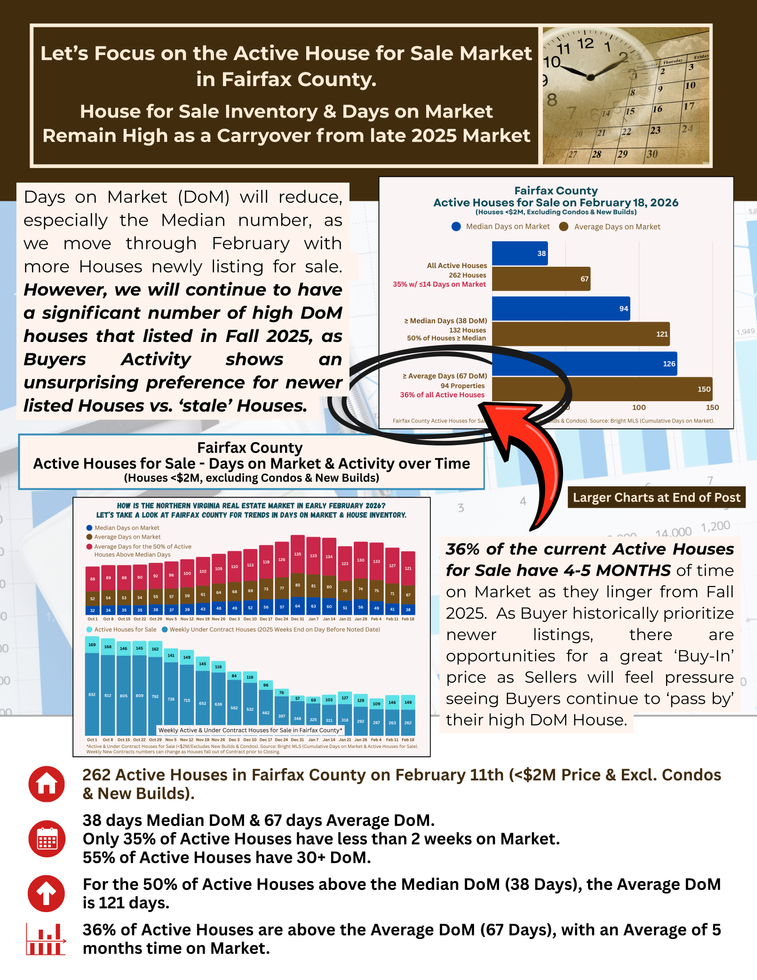
➡️ Only 35% of Active Houses in Fairfax County on February 18th have less than two weeks on Market. All DoM data is <$2M Houses, excluding Condos & New Builds.
➡️ 50% of Active Houses in Fairfax County on February 18th have a 4 month Average time on Market as they linger from Fall 2025. 36% of of Active Houses have a 5 month average time on Market.
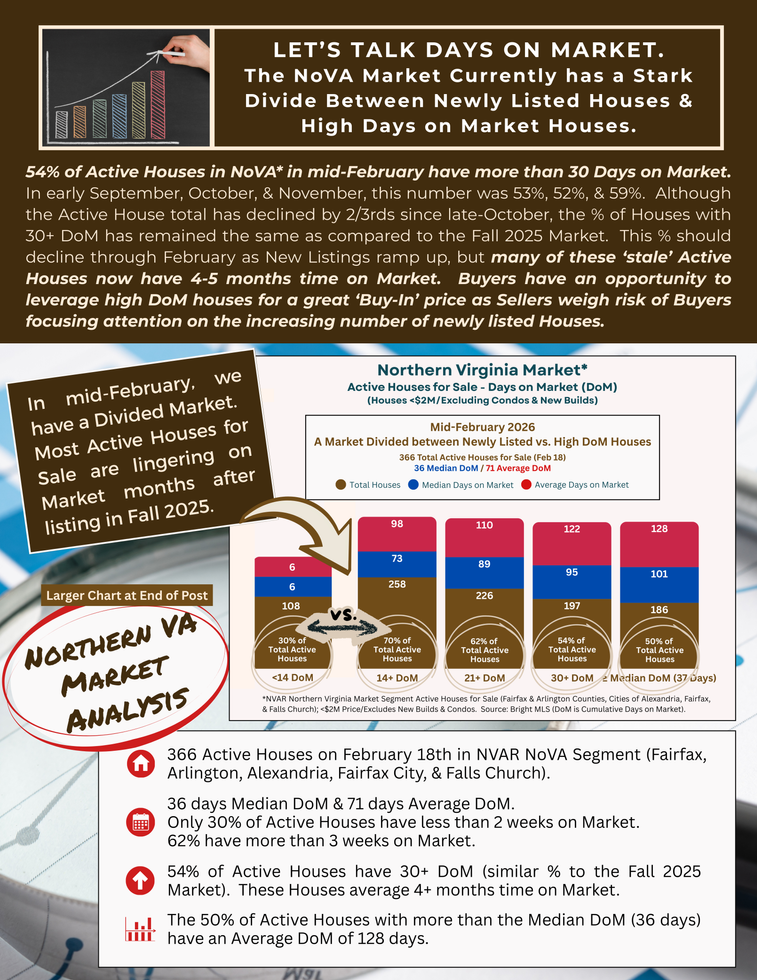
➡️ 54% of Active Houses in the NoVA Market segment* have 30+ Days on Market, with a 4 month Average. A similar % & DoM Average applies to Loudoun & Prince William. Although the Active House total has declined by 2/3rds since late-October, the % of Houses with 30+ DoM has remained the same as compared to the Fall 2025 Market. This % should decline as New Listings ramp up into March, but many of these ‘stale’ Active Houses now have 4-5 months time on Market.
* The Greater NoVA Market segment is Fairfax & Arlington Counties and the Cities of Alexandria, Falls Church, & Fairfax.
➡️ DoM numbers will also reduce, especially the Median number, as we move through February into March with more Houses newly listing for sale. However, we will continue to have a significant number of high DoM houses that listed in Fall 2025, as Buyers Activity shows an unsurprising preference for newer listed Houses vs. ‘stale’ Houses.
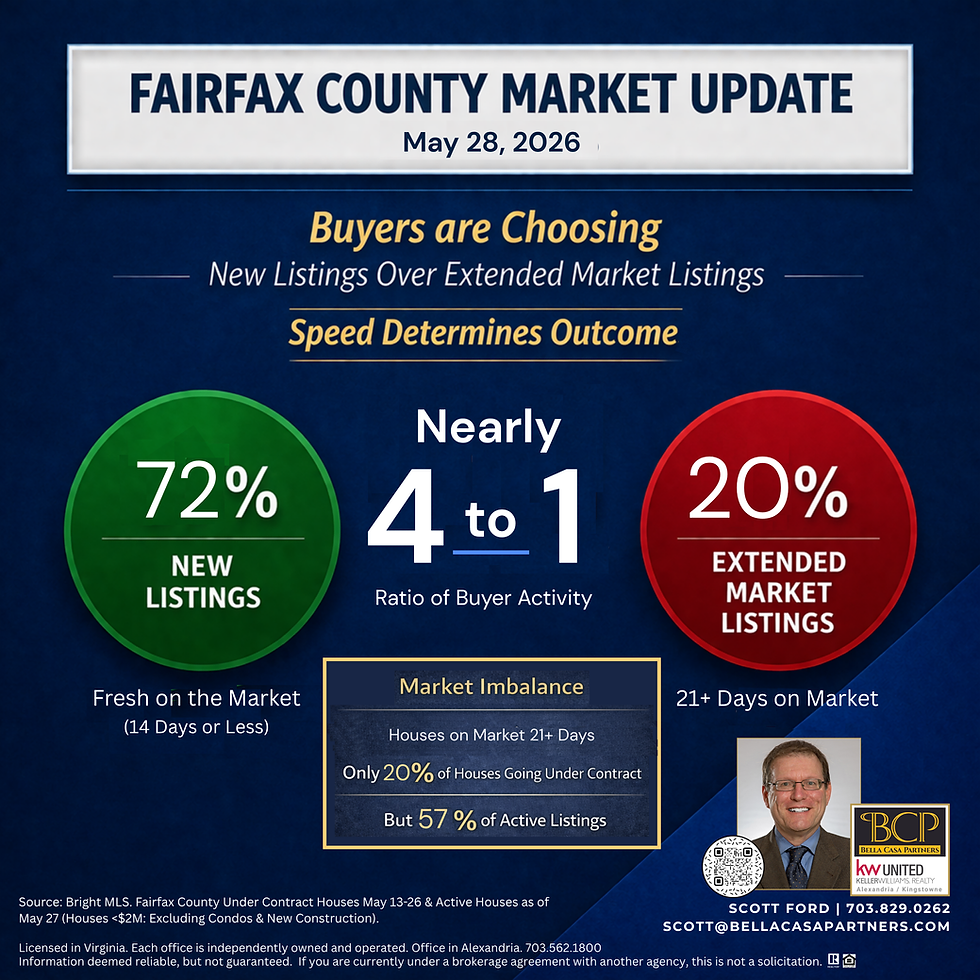
Buyers are focusing on newly listed Houses, rather than high DoM Houses from Fall 2025. High DoM Houses comprise most of the Active House Inventory. Contrast this data with Buying Activity so far in 2026 (Fairfax County) which reveals a Buyer focus on Houses listed in Jan-Feb compared to high DoM Houses dating from 2025 by a 2 to 1 split.
➡️ 73% of Houses going Under Contract in Fairfax County during the 3 weeks ending February 18th had less than two weeks on Market.
➡️ Only 20% of Under Contract Houses in Fairfax County during this 3 week period had more than the Average DoM (27 days), with these Houses averaging nearly 4 months time on Market.
➡️ Contrast the Buyer focus on newer listings shown by these Under Contract DoM numbers with the 55% of Active Houses for Sale on February 18th that had 30+ days on Market, with these Houses averaging 4+ months.
➡️ DoM numbers for Under Contract Houses are dropping as more New Contracts are Houses that listed in 2026 vs. the high DoM Houses carried over from 2025. This trend should continue, unless the long Buyer decision process seen throughout 2025 is present in 2026. If so, we should start to see 2026 listed Houses move into the 30+ DoM category for Active and Under Contract Houses.
Buyer opportunity exists to leverage high DoM Houses for lower ‘Buy-In’ price.
➡️ Sellers with high DoM Houses need to weigh risk of Buyers focusing on the ever increasing newly listed Houses, as their ‘stale’ House lingers.
The Spring 2025 Market Broke the Months of Supply Trend. Does this continue in Spring 2026?
➡️ The Months of Supply number typically falls during the peak Spring Market months (March through June), then rises to a yearly Peak in late-Summer into Fall.
➡️ The 2025 Spring Market broke the trend by increasing the Months of Supply each month. The Supply level stabilized at just under 2 months for the Northern Virginia market from April-October, which was the highest sustained level by far since 2018.
➡️ Months of Supply declined in Nov-Dec from this plateau. We started 2026 at a much lower Months of Supply number than the 2025 peak, but January 2026 was 20% higher than 2025.
Monthly Active House for Sale Inventory was Substantially Higher in Fairfax County for all of 2025 compared to 2024. Does this Continue in early 2026?
➡️ 2025 was a much different Market than Buyers & Sellers faced in 2023 & 2024. Buyers had far more choices due to higher Days on Market.
➡️ 2026 began with a higher baseline of Active Inventory in Fairfax County compared to the last three years, although only slightly higher than 2025 (+15%). New Listings & New Contracts will start to increase in February towards the peak in late-March through May. February numbers should provide a sign whether the Active Inventory level will be similar to 2025 or a quicker Buyer decision process vs. last year will hold Spring Market Inventory to levels seen in 2023 & 2024.
What is the Key Data to Watch through February?
🌟 Weekly New Contracts & New Listings numbers for signs of increased Buyer Activity from 2025 in response to ‘Spring Buying Market’ psychology & Mortgage Rates at a 3+ Year low point.
🌟 Whether the Active House Inventory returns to the prior Historical trend of falling during the Spring Market even as new Listings start to increase in February vs. Inventory increasing each month as in Spring 2025.
🌟Weekly Active House for Sale Inventory as a measure of whether the long Buyer house decision process in 2025 that increased Days on Market & Active Inventory level continues into 2026. Does Buyer Activity increase or quicken as New Listings start to ramp up in late-February into March? Do New Listings increase vs. 2025 as Sellers who deferred action in 2023-2025 due to higher Mortgage Rates now act to list their house with Rates at a 3+ Year low point?
Each chart in the Post is also included below for ease of data viewing.
🤔🙋🏼♂️ WANT TO SEE MORE MARKET ANALYSIS? See more market news, insight, & analysis on my "How's the Market?" Blog at bellacasapartners.com/marketnews.


Comments