Early December 2025 Northern Virginia Real Estate Market Update | Buyer Activity Not Changed Compared to 2024 by Either the Government Shutdown or High Inventory/Lower Mortgage Rates
- Scott Ford

- Dec 12, 2025
- 7 min read
Updated: Jan 15
How is the Northern Virginia real estate market in the first half of December? What does the current Market environment tell us about the early 2026 Market?
Did the Government Shutdown negatively affect Buyer activity? Did the higher Active House for Sale Inventory and lower mortgage rates compared to Summer 2025 bring increased Buyer Activity this Fall and early Winter?
The short answer to both questions is No.
At present, Buyer's have more leverage to get their Home of Choice than in the last 3 years due to the 'Buyer Leverage Trifecta', which is due in part to the continued high Days on Market and Active House for Sale Inventory as we moved through November towards the end of 2025.
Let's get the answers through a deep dive look at the Buyer Activity Level measured by New Contracts, Days on Market, and the Inventory of Houses for Sale.
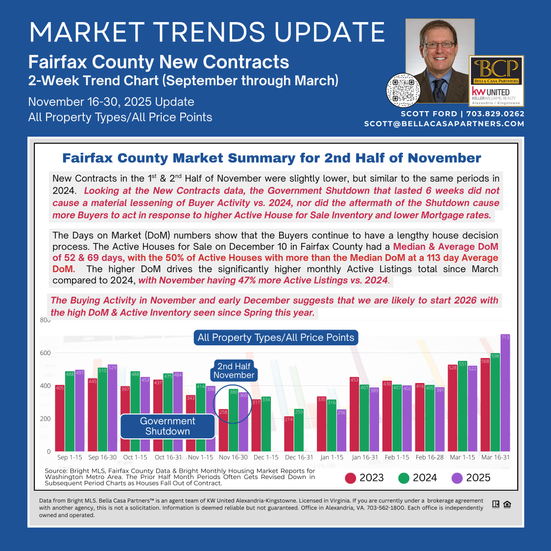
✨MARKET SNAPSHOT📷 The data on New Contracts shows that Buyer Activity did not decline during the 6 week Government Shutdown compared to 2024. Neither did the high Active Inventory level and lower Mortgage Rates (down to near 3 year low during October) cause a material increase in Buyer Activity during Fall to early Winter period.* Both the Greater NoVA Market segment** and Fairfax County had slightly higher Contract numbers during the Shutdown than in 2024 (i.e., Fairfax County was up 3.4% during the Shutdown/Greater NoVA Market segment was up 5.3%). The New Contracts total during the 4 weeks post-Shutdown are effectively identical to the 2024 numbers for both Fairfax and the Greater NoVA Market segment.
* Contracts for Houses <$2M, excluding Condos & New Builds.
**The Greater NoVA Market segment is Fairfax & Arlington Counties and the Cities of Alexandria, Falls Church, & Fairfax, plus Loudoun & Prince William Counties. The discussion below (& charts) uses the NVAR NoVA Market Segment, which omits Loudoun & Prince Williams Counties.
The higher Active Listing Inventory during the Spring and Summer months continued in November (up 47% in Fairfax County vs. 2024/NoVA Market segment up 45%). Buyers continue to have more House options. Buyers also continue to take more time to decide upon a house, with the Active Houses for sale in Fairfax County on December 10th having a 69 day Average time on market (& the 50% of Active Houses above the Median at a 113 day Average).
More options & a longer time to act means continued upward pressure on Days on Market (DoM), which is why we see an increasing DoM since the late Spring/Summer months, even as the level of Buying activity measured by New Contracts is in line with 2024 (All Property Types/All Price Points). Fairfax County has only 35 fewer Contracts through November compared to 2024. The NoVA Market segment has slightly more Contracts than 2024 (+1.3%/201 more Contracts over 11 months).
Buyers have more leverage to obtain their Home of Choice than in the last 3 years with the current Buyer Leverage Trifecta. When you couple high Inventory & DoM with the recent decline in Mortgage rates to a 1-year low on October 23 and December 4 (near a 3 year low for 30 Year Conventional Fixed Rate Mortgage on those dates) & Seller concern about lessening Buyer activity in the November-December Holiday Season, the current market environment creates a leverage opportunity for Buyers to explore. The 'Seasonality' part of this Trifecta will vanish in the New Year, along with a likely increase in Buyers as people newly enter the market as the "Spring Buying" Season starts in February.
I provide a Market Summary below, but read the full Post for all the details.
Each chart in the Post is also included below for ease of data viewing.


At the start of 2025, I began tracking New Contracts activity in Fairfax County for the first half/second half of each month, with a comparison to 2024 and 2023 Contract activity. This tracking provides real time insight into the Buyer activity trend, especially when compared to the notable increase in Days on Market data as the Spring 2025 market progressed, which continued in Summer into Fall. As the largest market in NoVA, Fairfax County is a good barometer of the Overall NoVa market.
Unless otherwise stated, the numbers below and in the early December 2025 NoVA Market Update refer to Fairfax County. All data is sourced from Bright MLS or NVAR Historical data.
➡️ New Contracts in the 1st & 2nd Half of November were slightly lower (down <5%) to the same periods in 2024.
➡️ Active Listings for Sale increased across all NoVA localities by a significant % in March through November compared to 2024. Fairfax County had 47% more Active Listings in November versus 2024. However, New Listings in Fairfax County were up only slightly through November vs. 2024 (+3.7% in Fairfax County/399 more Listings over 11 months). The NoVA Market segment* increased slightly more (+5%). The NoVA Market November monthly New Listing total was down vs. 2024 (-8.7%/71 fewer Listings).
*NVAR defines the NoVA Market segment as Fairfax & Arlington Counties and the Cities of Alexandria, Falls Church, & Fairfax.
➡️ The Months of Supply in April through July for the NoVA Market segment was approximately 2x higher than 2024, with August through November up 35-41% over 2024. The Months of Supply number was in a just under 2 months range for seven months (Apr-Oct). November Months of Supply is lower, but still 41% higher than 2024.
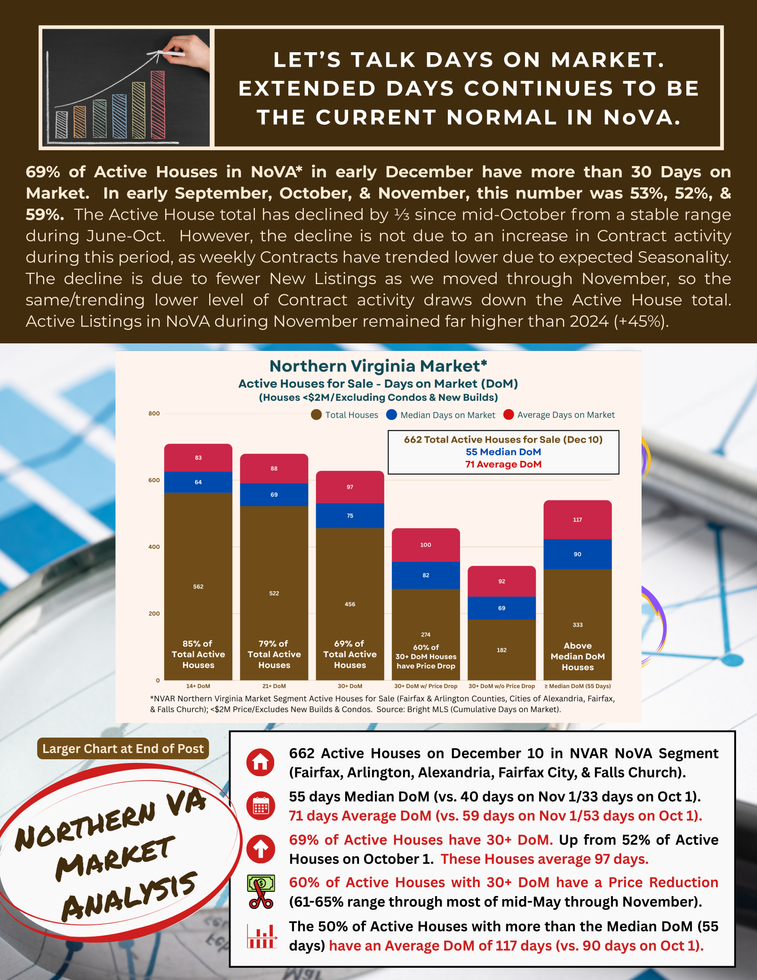
➡️ 69% of Active Houses in the NoVA Market segment in early December have more than 30 Days on Market. In early September, October, & November, this number was 53%, 52%, & 59%. The Active House total in the NoVA Market segment declined by ⅓ since mid-October from a stable range during June-Oct. The same decline occurred in Fairfax County. However, the decline was not due to an increase in Buyer Activity during this period, as weekly Contracts have trended lower due to expected Seasonality. The decline is due to fewer New Listings as we moved through November, so the same/trending lower level of Contract activity draws down the Active House total. Active Listings in NoVA during November remained far higher than 2024. (+45%).
*The Active Listing category includes all properties that were Active for Sale during the month. As houses stay on market longer, a house might be an Active Listing for 2-4 consecutive months, whereas the same house in 2024 would list and go under contract within 1 month.
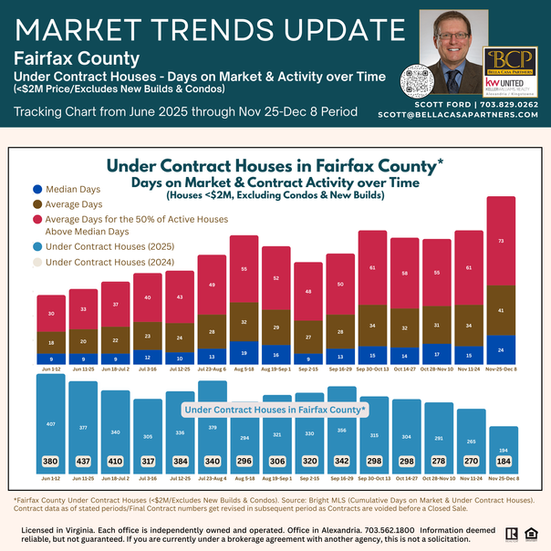
➡️ The DoM numbers show that the Buyers continue to have a lengthy house decision process. The Active for Sale Houses on December 10th in Fairfax County had a Median & Average DoM of 52 & 69 days. The 50% of Houses for Sale above the Median DoM had an average 113 days on market. The overall NoVA Market segment had similar DoM numbers (55/71/117 days). The increase in DoM stabilized at a high level from early July through October (with a slight upward trend). The DoM numbers increased by 2-3 weeks since the start of November, which is likely due to a reduction in Buyer Activity consistent with historical 'Seasonality' during the end of Year Holiday period.
➡️ The DoM numbers for houses going Under Contract at the end of November into December continue to show that a house is taking 2-3 weeks longer to get a Contract than the same period in 2024. The Median DoM for Under Contract Houses during November 25-December 8 period was 24 days. The Average DoM for a Contract during this period was 41 days. The 50% of Under Contract Houses with more than the Median had a 73 day Average DoM. The DoM data for this period is 7-10 days higher than the prior tracking period (Nov 11-24), which is likely due to fewer Active Buyers & an increase in the percentage of higher DoM Houses going Under Contract.
This DoM data - and the DoM data for prior two-week periods over the prior five months - suggests that if a house does not get a Contract during the first two weeks on market, Sellers face a likely potential for the House to wait a further month or longer. For houses that have more than the 1 month Average DoM, the wait for a Contract could be as long as 2+ months.
✨ WHAT AM I WATCHING IN THE MARKET?🔍👀 New Listings & New Contracts are at their lowest level during the December to mid-January period. A close look at Buyer Activity starting in early to mid-January into February is vital to see if the 2025 dynamic continues into early 2026.
Does Buyer Activity increase in early 2026 in response to the Leverage provided through a likely continuation of High Days on Market/High Active House Inventory & Lower Mortgage Rates? How will the increase in New Buyers and New Listings that historically come starting in late-January/early February affect the market environment?
We know that Buyers have more houses to choose from with the current higher Inventory level. More choices means a market environment where Buyers have more leverage than we have seen during the past three years. I see nothing in the current data that suggests that the high DoM level we currently have will abate. 2026 is likely to begin with a higher baseline Active House Inventory level and continuation of high DoM than we saw in the January-February period the last three years. Our market has been locked in a 1 month inventory range for so long that a 2 month supply of Inventory “feels” & “acts” like a Balanced Market.
The key Market question for early 2026 is whether the Month of Supply and Active Listings numbers repeat the Spring 2025 Market monthly increase due to a continued longer Buyer decision process? Do we return to the prior Historical trend of Supply falling even as new Listings start to increase in February. Do we revert back to Buyer Activity seen in early 2024 and 2023 (i.e., Buyers quicker to act, which soaks up Active Inventory as New Listings increase starting in February)?


🤔🙋🏼♂️ WANT TO SEE MORE MARKET ANALYSIS? For my most recent Deep Dive into Buyer activity, high Active House for sale Inventory & Days on Market in the Northern Virginia market, and the (lack of) impact of the Government Shutdown on Buyer activity compared to 2024, check out my early November 2025 NoVA Market Update.
The next deep dive NoVA Market analysis update will be posted in early January once we get some new data that is not impacted by the reduced activity during the Christmas/New Year Holiday period.
See more market news, insight, & analysis on my "How's the Market?" Blog at bellacasapartners.com/marketnews.


Comments