September 2026 Northern Virginia Real Estate Market Update | Inventory continues to rise while Buyer activity declines & remains concentrated on New Listings

Updated: 5 minutes ago
A data-driven analysis of Buyer activity, inventory levels, and how the market is split between New Listings and Houses with extended time on market. Tracking Buyer activity and inventory trends helps explain the driving forces shaping the current market—and where the market may be heading next.
The current Northern Virginia housing market has a combination of trends that increasingly define the current environment: higher inventory, longer Buyer decision times, and Buyer activity that remains heavily concentrated on newly listed Houses.
September also provided an answer—at least for now—to one of the principal questions raised in the Mid-August Market Update.
During August, Buyers increasingly shifted toward Houses with 30+ Days on Market as fewer New Listings entered the market. Once New Listings increased in September, however, Buyer activity shifted sharply back toward newer inventory. During the last two week tracking period (September 16–29, 61% of Fairfax County Houses going Under Contract had 14 or fewer Days on Market, while only 25% had 30+ Days on Market.
That shift matters because the inventory Buyers are favoring is not where most of the inventory exists.
As of September 30, only 23% of Active Fairfax County Houses were within their first 14 Days on Market. By contrast, 56% had 30+ Days on Market and 32% had 60+ Days on Market.
The result is an increasingly important structural imbalance between where Buyer attention is concentrated and where available inventory is concentrated.
Perhaps the most important data from September is that Buyer activity measured by New Contracts significantly lagged last year, as New Contracts for the second half of the month has a 22% year-over-year decline. This decline follows a 13% decline for the first half of September vs. 2025.
This decline in Buyer activity is concurrent with mortgage interest rates spiking during September to a near 3-year high point.
Unless stated otherwise, all data in this post is for Houses ≤$2M, excluding condos and new construction.

What Four Numbers Tell Us About the Current Fairfax County Market

Four numbers provide a useful snapshot of the current market:
+33%: Fairfax County Active House inventory compared with 2025.
+83%: larger total New Listings-to-New Contracts gap during September 1-27 compared with 2025.
56%: share of Active Houses having 30+ Days on Market.
25%: share of recent New Contracts with Houses having 30+ Days on Market.
These numbers are important not simply because inventory is higher.
They describe how that inventory is being distributed and absorbed.
More than half of the Active House inventory has 30+ Days on Market, but only approximately one-quarter of recent Buyer activity has been directed toward that segment. Meanwhile, New Listings continue to enter the market faster than Houses are going Under Contract.
That combination helps explain why extended-market inventory can continue accumulating even when Buyers remain active.
Is Buyer Demand Declining in the Northern Virginia Market?
September has introduced another factor into the inventory equation: Buyer activity is now significantly lagging 2025 based upon September numbers for New Contracts.

Fairfax County New Contracts during the second half of September were 22% lower than the comparable 2025, representing 117 fewer Contracts across all property types and price points. This decline follows the 13% decline in New Contracts activity during the first half of September.
The significant September decline follows a 6% year-over-year decline in August, after New Contract activity during June and July was essentially flat compared with 2025.
This decline is important as a gauge of the current activity trend as we begin October.
For much of the Summer, rising inventory could not be explained primarily by a substantial reduction in the number of Buyers entering Contracts. Buyer activity remained relatively close to 2025 while Houses accumulated on the market.
The data increasingly supported longer Buyer decision times as an important driving factor for the higher inventory level. Buyers continued purchasing Houses, but a growing percentage of Active Houses remained on the market for a longer period.
This longer Buyer decision process remained in September. But weaker New Contract activity is now creating an additional source of upward inventory pressure.
New Listings since the beginning of August have generally tracked close to 2025 levels, so we do not have a relative increase in Houses coming to market compared to last year. However, as discussed later in this update, the weekly number of New Listings in September continue to far outpace New Contracts. This imbalance between supply and absorption can further increase our already high inventory level, as it shows a lessening of Buyer activity, rather than an increase in New Listings coming to market.
Where Are Buyers Directing Their Activity?
The total number of New Contracts tells only part of the story.
The distribution of those Contracts by Days on Market tells us where Buyers are directing their attention.
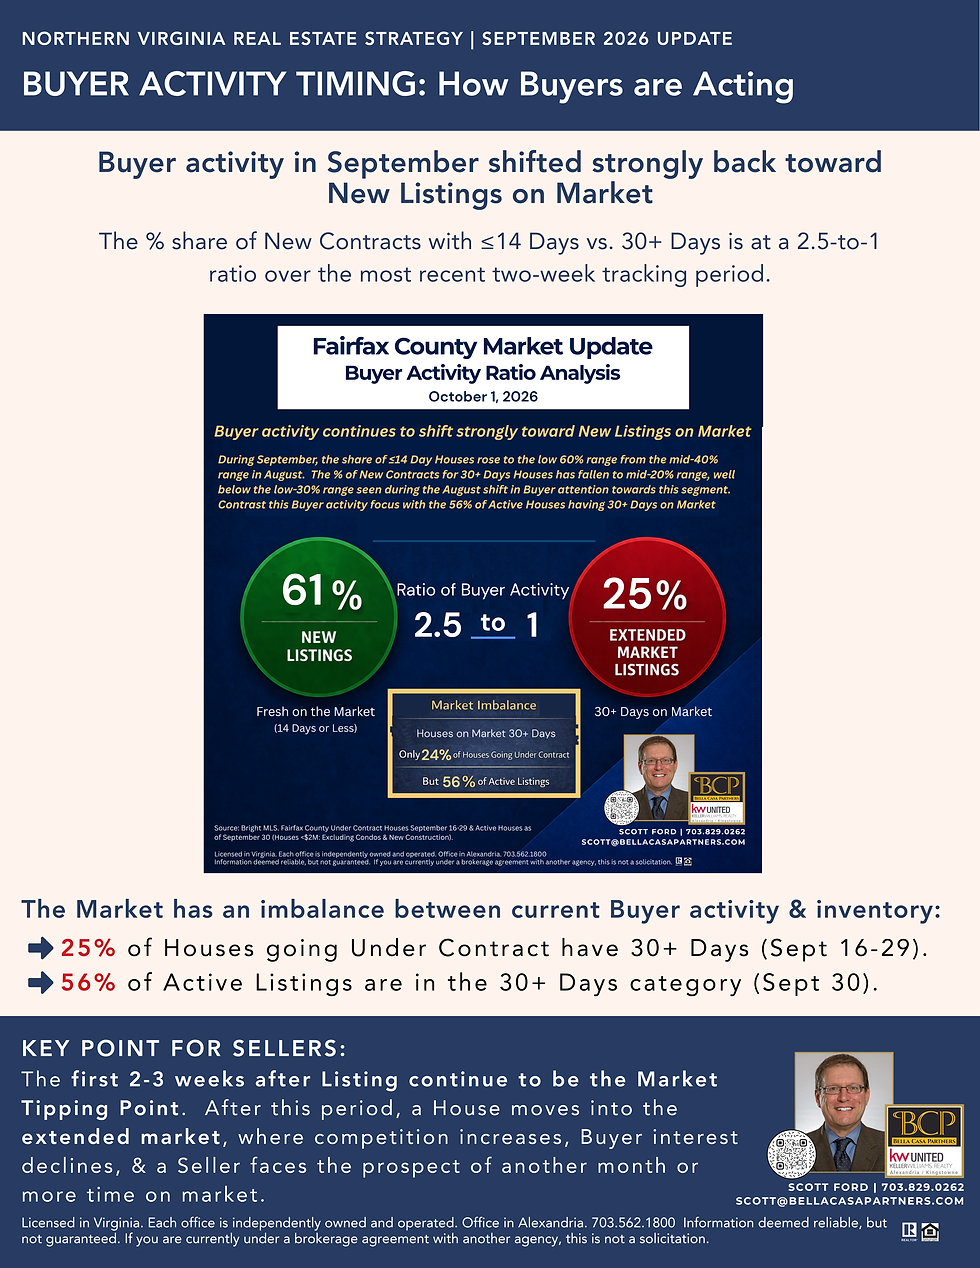
During the most recent two-week tracking period (September 16–29):
61% of Houses going Under Contract had 14 or fewer Days on Market.
25% had 30+ Days on Market.
The ratio between the two groups was approximately 2.5-to-1.
However, during the most recent week, September 23–29, the difference notably narrowed: 57% versus 26%, but still more than a 2-to-1 ratio.
The current ratio is a substantial reversal from August.
During August, the share of Buyer activity involving 30+ Day Houses increased while the share involving newly listed Houses declined. The two categories moved much closer to parity.
The September data now provides an important clue as to why that shift toward longer Days on Market Houses occurred, and why Buyer activity has shifted back toward New Listings.
What Happened to the August Shift Toward Longer Days on Market Houses?
During late July and August, the number of New Listings declined seasonally. At approximately the same time, Buyers began directing a larger share of their Contract activity toward Houses that had already accumulated 30+ Days on Market.
That raised what I referred to in the Mid-August Market Update as the “September Question”:
Would Buyers continue directing a larger share of activity toward older inventory once September brought more New Listings? Or would they return to favoring newly listed Houses?
So far, the answer is clear.
As New Listings increased in September, Buyer activity returned sharply toward newer inventory. The weekly share of New Contracts involving ≤14-Day Houses increased from 43–55% during much of August to 62% and 64% during the two week period of September 9–22. At the same time, the 30+ Day share fell to 25% and then 24%.

The timing suggests that the August shift toward older Houses was influenced by the reduced number of New Listings available to Buyers during the late-Summer period, rather than a fundamental change in Buyers seeing greater negotiating leverage in longer Days on Market Houses.
When Buyers received more new choices in September, their activity again became concentrated on those newer listings.
However, does the % decline in New Contracts for ≤14-Day Houses (and the slight increase in % for 30+ Days Houses) in the most recent tracking week (September 23-29) signal more Buyer attention on longer Days on Market Houses in October as New Listings decline compared to September? In other words, will be see a return to the increased % of 30+ Days Houses going Under Contract from August?
Next week's New Contracts tracking data should provide clarity on this question.Does the most recent week signal more attention on
high Days Houses in October as New Listings decline?
Why Does Northern Virginia Inventory Continue to Build?
The weekly inventory data provides another part of the answer.

As of the week ending September 27, Fairfax County Active House inventory was 33% above the comparable 2025 level, reaching its highest point of 2026. This weekly data provided by Bright MLS is for all property types and all price points.
New Listings have also exceeded New Contracts for 31 consecutive weeks.
During the first four weeks of September, the gap between total New Listings and New Contracts was 83% larger than during the comparable 2025 period.
This matters because 2025 was not a low-inventory year, as monthly inventory levels from March through October 2025 were significantly higher than the prior year. For context, September 2025 inventory was already 33% above September 2024.
The current market therefore is not simply mirroring last year's higher inventory environment. It is moving above an already elevated baseline.
Two forces are now contributing to that inventory pressure:
1. Longer Buyer decision times. Houses remain Active longer, causing inventory to accumulate.
2. Lower September Contract activity. Fewer Contracts relative to incoming supply can further reduce the rate at which existing inventory is absorbed.
Together, these conditions provide additional evidence of the Inventory Build Spiral first identified in the Mid-July Market Update.
Why Does the 2–3 Week Market Tipping Point Still Matter?
The September data reinforces the 2–3 Week Market Tipping Point identified in earlier BCP market analysis.
The issue is not that a House cannot sell after its first several weeks on the market. Many do.
The issue is that the competitive environment changes materially.
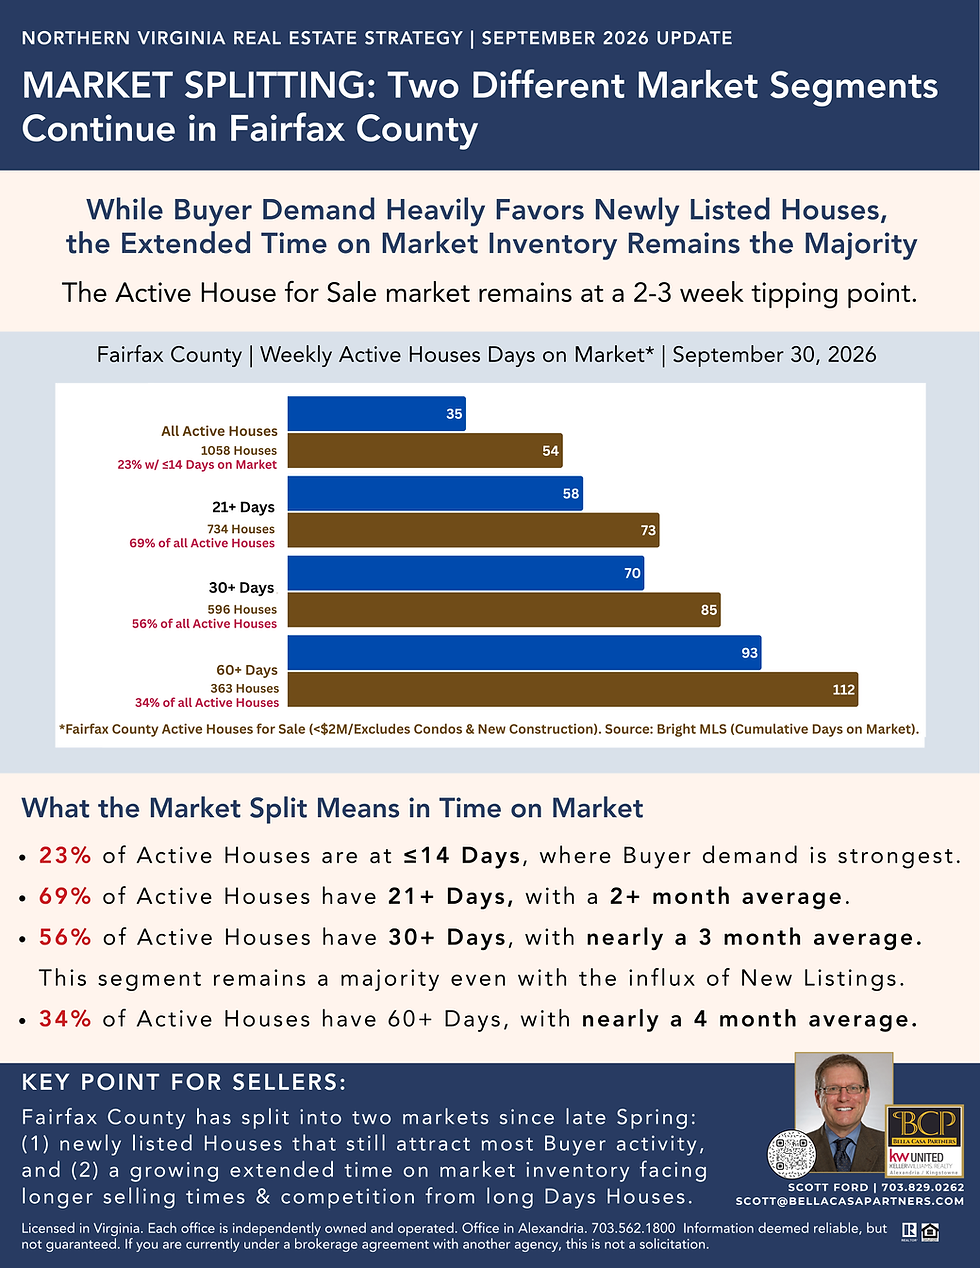
During the first 14 days, a House is competing within the relatively small segment of newly listed inventory where Buyer activity is currently most concentrated. Once the House moves into extended time on market, it joins a much larger inventory pool competing for a substantially smaller share of Buyer activity.
As of September 30:
23% of Active Fairfax County Houses had ≤14 Days on Market.
69% had 21+ Days on Market.
56% had 30+ Days on Market.
34% had 60+ Days on Market.
The average Days on Market also rises substantially within those extended-market categories. Houses with 30+ Days on Market were averaging nearly three months of market exposure, while Houses with 60+ Days were approaching a four-month average.
For Sellers, this is why the initial listing period remains so consequential.
The objective is to position the House as a Preferred Choice while Buyer attention is most concentrated, rather than relying on future Buyers to emerge after the House has entered a larger and more competitive extended-market inventory pool.
Is the Extended-Market Pattern Limited to Fairfax County?
No. The broader Northern Virginia data shows the same market structure.
For the Northern Virginia segment tracked in this analysis—Fairfax and Arlington Counties and the Cities of Alexandria, Fairfax, and Falls Church—September 30 data showed:
23% of Active Houses at ≤14 Days on Market.
64% at 21+ Days.
56% at 30+ Days, with nearly a 3-month average time on market.
34% at 60+ Days, with nearly a 4-month average.

The similarity to Fairfax County is notable.
In both datasets, approximately less than 1/4 of Active Houses are newly listed while more than half have 30+ Days on Market.
That consistency indicates that the split between newly listed and extended-market inventory is a regional market dynamic, rather than an isolated Fairfax County condition.
Is the Inventory Build Spiral Continuing?
The Inventory Build Spiral describes a potential self-reinforcing market cycle:
Buyers take longer to select a House → Houses remain Active longer → inventory increases → Buyers have more choices → urgency declines → decision times can extend further → additional inventory accumulates.
The September data provides additional evidence that this mechanism remains relevant.
The market now contains substantially more inventory than last year, the majority of Houses have extended Days on Market, and Buyers continue directing most of their activity toward a relatively small segment of newly listed Houses.
September has added another variable: Contract activity is now lagging 2025.
This data does not mean inventory must continue increasing indefinitely.
Changes in New Listing activity, mortgage rates, Buyer demand, Seller withdrawals, or normal seasonal patterns can alter the trajectory.
But based on the current data, the forces producing elevated inventory have not yet meaningfully reversed.
How High Has Northern Virginia Inventory Become?
Two monthly datasets provide useful historical context.
Northern Virginia Months of Supply
Northern Virginia Months of Supply reached 2.08 months in August 2026.

The August number was slightly below July's 2.13 months, but it remained above the elevated plateau established during much of 2025 and was more than twice the August 2024 level.
April through July 2026 showed a steadily escalating monthly trend. August interrupted that progression, but weekly September inventory has subsequently moved higher again, which suggests the September Months of Supply number could increase over August.
Fairfax County Active Listings
Fairfax County shows a similar longer-term pattern.
August 2026 Active Listings were 20% higher than August 2025 and 57% higher than August 2024.

The increase is particularly notable because Spring 2026 inventory had initially tracked relatively close to the already elevated 2025 levels before moving materially higher in July and August.
August New Contracts were down 7% from 2025 while New Listings were nearly flat, further contributing to the imbalance between incoming inventory and absorption.
What Should Northern Virginia Sellers Take From the September Market Data as a Signal for October?
The September data does not mean that Buyers have stopped purchasing Houses.
It does mean that Buyer attention is highly selective.
Newly listed Houses continue to receive a disproportionately large share of Contract activity, while a majority of available inventory has already moved into extended Days on Market.
For Sellers preparing to enter this environment or a Seller with a longer Days on Market House, three considerations become particularly important:
The initial listing period matters. Buyer attention is most concentrated during the first several weeks.
Significant competing Houses for longer Days on Market Houses. Once a House accumulates Days on Market, it enters a large pool of extended-market inventory competing for fewer Buyers.
Positioning must account for greater Buyer choice. Pricing, preparation, visual presentation, and the overall Buyer experience need to work together to make the House a Preferred Choice at launch.
The objective is not simply to place a House on the market. It is to engineer Buyer preference while attention is greatest.
That is particularly important in a market where inventory is elevated and Buyers have demonstrated a willingness to wait.
What Should We Watch Next?
The next 1-2 weeks should help answer three questions.
Does the weaker Buyer activity in the second half of September persist into October? The second half of September was 22% below 2025, following a 13% decline for the first half of the month. Whether that develops into a sustained decline in Contract activity will affect the inventory trajectory.
Does Buyer activity remain concentrated on New Listings? September's return to a roughly 2.5-to-1 ratio between newer listings and 30+ Day Houses suggests that the August shift toward 30+ Days Houses was temporary. Continued weekly tracking will show whether that pattern persists, but the current trend suggests continued Buyer concentration on New Listings. The most recent week's data (September 23-29) may signal a decline in the % of New Listings of total New Contracts going forward as the number of New Listings decline in late September and into October.
Does inventory continue moving higher before the normal end of Fall seasonal decline? Fairfax County weekly inventory has already reached a new 2026 high. The interaction among New Listings, New Contracts, and Seller withdrawals will determine whether inventory rises further or begins its normal seasonal contraction as we move to the end of October and into November.
Those questions will be central to assessing whether the Inventory Build Spiral continues through the Fall market or begins to moderate.
Bottom Line on the September Northern Virginia Market
The September market was defined by a disconnect between Buyer activity and the composition of available inventory.
Buyers shifted sharply back toward newly listed Houses. Yet most Active inventory has already accumulated extended Days on Market. At the same time, New Contract activity is now significantly lagging 2025 and Active inventory has moved substantially above last year's already elevated levels.
That combination creates a market in which Buyer activity still exists, but Buyer attention is concentrated and increasingly valuable.
For Sellers, the implication remains consistent: the first several weeks on market represent the period when Buyer attention is greatest. In an environment with more inventory, more Buyer choice, and a large extended-market segment, positioning the House to become a Preferred Choice at launch is increasingly important to the eventual outcome.
Recommended Reading
For additional analysis of the Northern Virginia real estate market and the trends discussed in this Market Update:
Mid-August 2026 Northern Virginia Real Estate Market Update. See how the August data identified the temporary shift in Buyer activity toward 30+ Days on Market Houses and raised the “September Question.”
Northern Virginia Strategic Insight Report | Volume 2: The 2–3 Week Market Tipping Point. A deeper analysis of why Buyer attention during the initial listing period can materially affect a House's competitive position once it enters extended time on market.
Mid-July 2026 Northern Virginia Real Estate Market Update. See the earlier analysis that introduced the Inventory Build Spiral and examined how longer Buyer decision times can contribute to rising Active inventory.
Frequently Asked Questions
Is the Northern Virginia real estate market slowing down?
Buyer activity during September materially lagged 2025. Fairfax County New Contracts during the second half of September were 22% below the comparable 2025 period, following a 13% decline during the first half of the month. However, the current market is also being shaped by longer Buyer decision times and the majority of Active House inventory with extended Days on Market.
Why is housing inventory increasing in Northern Virginia?
Several factors are contributing. New Listings have exceeded New Contracts for 31 consecutive weeks in Fairfax County, Buyers are taking longer to select Houses, and September Contract activity materially lagged 2025. Together, these conditions allow more Houses to remain Active and accumulate in inventory.
Are Buyers still favoring newly listed Houses?
Yes. During the September 16–29 tracking period, 61% of Fairfax County Houses going Under Contract had 14 or fewer Days on Market, compared with 25% with 30+ Days on Market. The September data shows Buyer activity shifting strongly back toward New Listings after temporarily moving toward older inventory during August. However, Under Contract % ratio data for the last week of September (23-29) may signal an increase in Buyer attention on longer Days on Market Houses during October.
What is the Inventory Build Spiral?
The Inventory Build Spiral describes a potential self-reinforcing market cycle: Buyers take longer to select a House, causing Houses to remain Active longer. That creates more inventory and more choices for Buyers, which can further reduce urgency, extend decision times, and cause additional inventory to accumulate.
Why are the first 2–3 weeks important for Northern Virginia Sellers?
Buyer activity is currently concentrated on newer inventory. Once a House moves beyond its initial listing period, it enters a much larger pool of longer Days on Market Houses competing for a smaller share of Buyer activity. This makes pricing, preparation, presentation, and positioning during the initial listing period particularly important.
What percentage of Fairfax County Houses have been on the market for 30 days or longer?
As of September 30, 56% of Active Fairfax County Houses priced at $2 million or less, excluding condos and new construction, had 30+ Days on Market. 34% had 60+ Days on Market. These segments averaged nearly 3 and 4 months time on market, respectively.


Comments