Mid-August 2026 Northern Virginia Real Estate Market Update | Inventory Continues to Build as Buyers Take Longer to Decide

Updated: Sep 3
Northern Virginia is entering the final weeks of summer with an unusual combination of market conditions. The mid-August 2026 Market Update analyzes data on Buyer activity, inventory level, and Days on Market to assess not only the current market environment, but how the market is trending as we look to September.
The mid-month Market Updates are a data-driven analysis of Buyer activity, inventory levels, and how the market is split between New Listings and Houses with extended time on market. Tracking Buyer activity and inventory trends helps explain the driving forces shaping the current market—and where the market may be heading next.
Buyer activity remains solid. New Contracts in Fairfax County have closely tracked 2025 levels since June. Yet Active inventory has continued to move substantially higher. By mid-August, weekly Fairfax County Active House inventory was 23% above the same period in 2025, even though New Listings and New Contracts over the past month have been in line with last year's levels.
These trends provide additional evidence for a market dynamic I introduced in the Mid-July Northern Virginia Market Update: the Inventory Build Spiral.
At the same time, Buyers are increasingly purchasing Houses that have been on the market longer. The share of weekly New Contracts going to 30+ Days on Market Houses has nearly doubled since mid-July, while the share going to Houses within their first 14 Days has declined substantially.
A question heading into September is whether the Northern Virginia market has entered a self-reinforcing cycle in which Buyers are taking longer to decide upon a House, more Houses stay on market longer, more inventory gives Buyers more choices, more choices extend the Buyer decision process, and longer decision times cause still more inventory to accumulate.
Another question is whether the recent shift toward putting a greater share of 30+ Days on Market Houses Under Contract reflects the seasonal decline in New Listings during late July through mid-August. Will Buyers return to their prior concentration on New Listings with the expected increase in Houses coming to market in September? Or does the shift indicate that Buyers are increasingly recognizing the leverage opportunities available among the large number of longer Days on Market Houses?

Is Buyer Demand Declining in the Northern Virginia Market?
The data does not indicate a decline in overall Buyer activity.
Fairfax County recorded only 13 fewer New Contracts during the first half of August than during the same period in 2025. Looking further back, total New Contracts since June were only 17 Contracts below the 2025 level across all property types and price points.
That is important because it separates two concepts that can easily be confused:
Higher inventory does not necessarily mean Buyers have disappeared or that Buyer activity has lessened. Instead, the current data is increasingly consistent with Buyers taking longer to select a House.

This distinction becomes clearer when we examine the Days on Market data for Houses going Under Contract.
Are Buyers Taking Longer to Select a House?
The weekly Fairfax County Under Contract Days on Market data provides some of the strongest evidence that the Buyer decision process has changed.
In March through May, the weekly median Days on Market for Houses going Under Contract was generally only 5–10 days. Average Days on Market was generally in the mid-teens to around 20 days.
A material change to that pattern started in June, then accelerated over the past month. The median Days and average Days numbers have now doubled since May.
The Days on Market (DoM) data for the last four weekly periods:
Weekly Period | Under Contract Houses Median DoM | Under Contract Houses Average DoM | Average DoM for the 50% of Under Contract Houses with Above the Median DoM |
July 23–29 | 13 | 36 | 64 |
July 30–Aug. 5 | 16 | 35 | 63 |
Aug. 6–12 | 21 | 34 | 59 |
Aug. 13–19 | 19 | 38 | 64 |
The latest weekly data shows that the typical House going Under Contract is taking considerably longer to do so than during the Spring market.
A close look at median Days on Market is also important. During August 13–19, the median was 19 Days. However, the median number tells only half the story. To understand the extended side of the Under Contract market, it is also useful to examine the 50% of Houses that went Under Contract above the weekly median Days on Market. Over the past four weeks, those Houses averaged approximately 2 months before going Under Contract.

This data is evidence that a meaningful portion of Buyer activity is taking longer for a decision upon a House. The next section discusses the data showing a recent shift in Buyer activity to put a greater % share of New Contracts on Houses with longer Days on Market.
Where Are Buyers Directing Their Contract Activity?
In mid-July, Buyer activity in Fairfax County was still overwhelmingly concentrated on newer inventory (Houses ≤$2M; Excluding Condos & New Construction). The ratio of New Contracts for ≤14 Days Houses vs. 30+ Days Houses was 3-to-1 during the two-week overlapping tracking periods in early to mid-July. By the most recent two-week tracking period (August 5-18), the ratio had fallen to a near parity, at 1.3-to-1.

Tracking the New Contract % ratio on a weekly basis shows this shift in Buyer activity even more starkly.
For the week of July 8–14:
62% of New Contracts involved Houses with 14 or fewer Days on Market.
Only 17% involved Houses with 30+ Days on Market.
By August 12–18:
The ≤14 Days share had fallen to 43%.
The 30+ Days share had increased to 33%.
The gap between those two market segments therefore compressed from more than 3-to-1 to approximately 1.3-to-1 in just over a month.

This is a significant change in Buyer behavior.
But it should not be interpreted as evidence that the market imbalance between Buyer contract activity and the Active House inventory with longer Days on Market has disappeared.
Why Does the 2–3 Week Market Tipping Point Still Matter?
Despite Buyers directing more activity toward longer Days on Market Houses, the extended market remains disproportionately large. Further, Buyers still put more lower Days on Market Houses Under Contract each week, even with the decline in % share over the past month.
During August 5–18, 33% of Houses going Under Contract had 30+ Days on Market. 44% of Houses going Under Contract had ≤14 Days on Market.
But as of August 19, 56% of Fairfax County Active Houses were already in the 30+ Days on Market category, with a 2 1/2 month average time on market. At the same time, only 25% of Active Houses had ≤14 Days on Market.
That gap is the critical point.
Buyer activity has shifted more attention toward longer Days on Market Houses—but not enough to absorb that inventory at the rate it has accumulated. Further, the total number of weekly New Contracts has remained stable over the last month, so the overall inventory is not being reduced.
For Sellers, this is why the first 2–3 weeks after listing remain the Market Tipping Point.
A House that does not capture sufficient Buyer attention during that initial period does not simply become one week older. It moves into a fundamentally different competitive segment containing substantially more inventory and generally less concentrated Buyer activity.
The Inventory Build Spiral: What Happens When Buyers Take Longer to Decide?
The mid-July 2026 Market Update introduced the Inventory Build Spiral as a potential explanation for the market's changing structure.
One month of additional data provides greater support for that concept.
The spiral can be summarized this way:
Buyers take longer to select a House → Houses remain Active longer → Buyers have more choices → Buyers feel less urgency → more Houses remain Active longer → Time on Market continues to accumulate → inventory increases further.
The weekly inventory data now shows several components of that spiral occurring simultaneously.
New Listings have exceeded New Contracts in Fairfax County for 25 consecutive weeks.
Active inventory reached its highest point relative to 2025 during the week ending August 16, at 23% above last year. This year-over-year increase is notable because 2025 inventory itself was already substantially elevated compared with 2024 (July 2025 +40% vs. 2024 | August 2025 +31% vs. 2024).

But the most important evidence is not simply that inventory is higher.
It is the combination of:
Buyer activity remaining near 2025 levels + longer average Days on Market for Under Contract Houses + an increasing amount of Active inventory at longer Days on Market + rising total inventory compared to last year.
Those four trends fit together.
They suggest that the velocity of the market has changed even though the underlying level of Buyer activity has not changed nearly as much.
The data increasingly supports longer Buyer decision times as an important driving factor in the current market environment.
This market behavior is the core of the Inventory Build Spiral thesis.
Is the Inventory of Longer Days on Market Houses Increasing Across Northern Virginia?
On August 19, Active Houses in Fairfax County (≤$2M; Excluding Condos & New Construction) had the following allocation based upon Days on Market:
25% of Active Houses had 14 Days or less on market.
68% had 21+ Days on Market.
56% had 30+ Days on Market.
29% had 60+ Days on Market.
The % for the 21+, 30+, and 60+ Days are the highest so far in 2026, with a substantial increase in each segment over the past two months.

The Days on Market numbers for the Northern Virginia market segment I track—Fairfax and Arlington Counties and the Cities of Alexandria, Falls Church and Fairfax—were almost identical to the Fairfax County numbers on August 19.
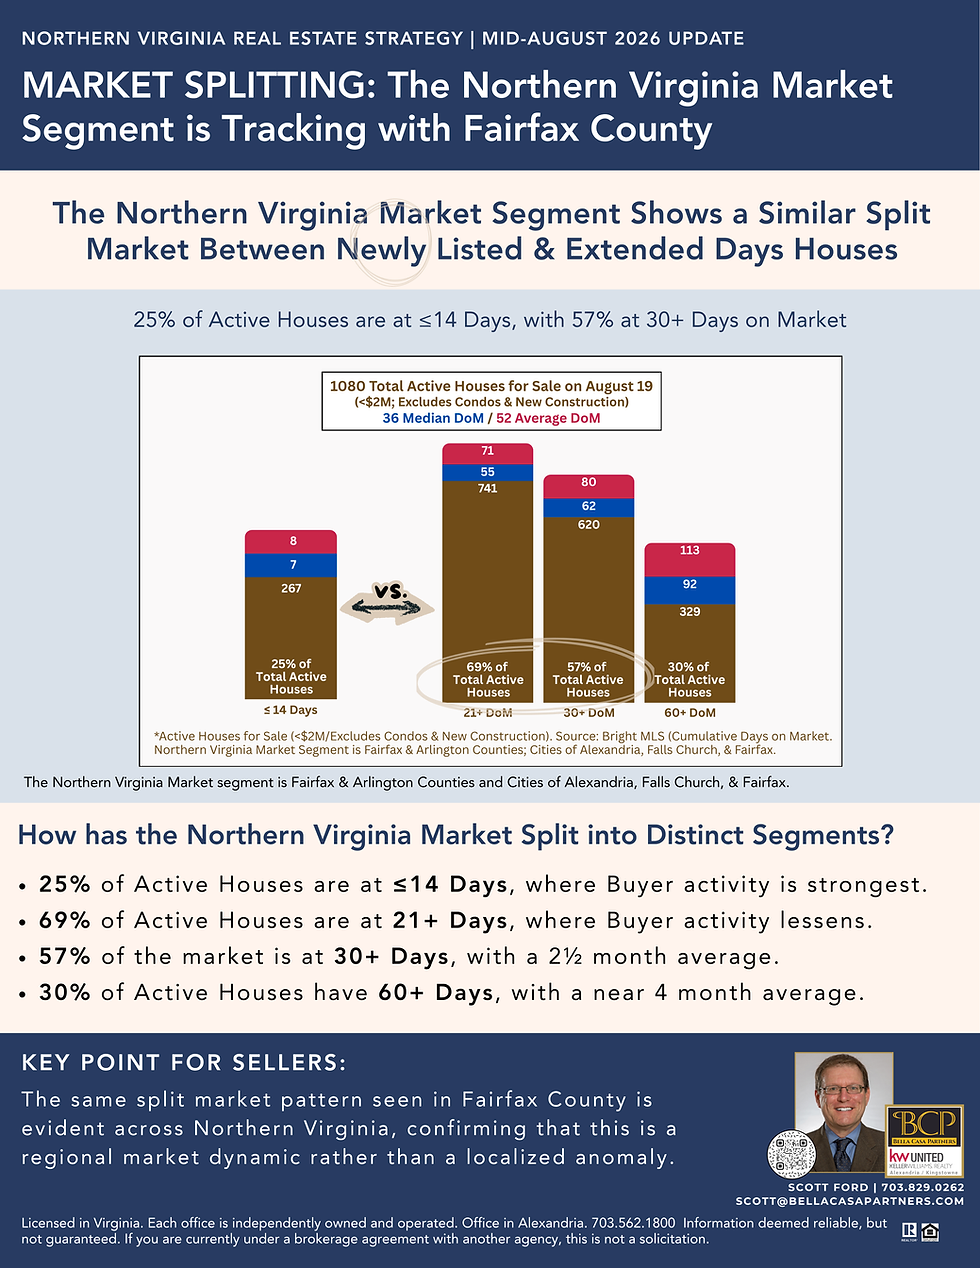
The similarity is significant because it indicates that the split-market condition (≤14 Days Houses vs. longer Days on Market Houses) is a regional market dynamic rather than a Fairfax County anomaly.
How High Has Inventory Become in the Northern Virginia Market?
The monthly data provides another perspective on the rising inventory trend.
Measured by Months of Supply in the Northern Virginia market segment and monthly Active Listings in Fairfax County, the current market is at the highest inventory level in years (my monthly tracking begins in 2022, as monthly inventory levels in prior years were even lower).
Months of Supply in the Northern Virginia market segment reached 2.13 months in July 2026, moving above the elevated, but relatively stable range that characterized much of Spring through Fall 2025.
The April-through-July 2026 progression also shows an escalating monthly trend that was not present during the 2025 inventory plateau.

The monthly tracking of Fairfax County Active Listings tells a similar story.
July 2026 Active Listings were 20% higher than July 2025 and 68% higher than July 2024. After relatively small year-over-year differences during Spring 2026, the inventory gap widened substantially during June and July and continued into mid-August (as evidenced by the 23% higher year-over-year inventory level as of August 16).

The weekly inventory numbers through mid-August indicate that the August monthly numbers for Months of Supply and Active Listings are likely to move upwards from the July numbers.
The important development is therefore not merely that Northern Virginia has “more inventory.” We should take note that inventory has moved beyond the already elevated 2025 levels and is showing an escalating trend that suggests we may see an even higher inventory level in September.
What Should Northern Virginia Sellers Take From the Mid-August Market?
The current market does not support a simplistic conclusion that Buyers have disappeared or even that they have lessened their buying activity.
Instead, it presents Sellers with a more complicated problem:
Buyers are present, but they have more choices and appear increasingly willing to take more time making their purchasing decisions.
That changes listing strategy.
The objective is not merely to put a House on the market at a defensible price and wait for demand to find it. The objective is to make the House a Preferred Choice while Buyer attention is most concentrated during the first two weeks, increasing the likelihood that a Buyer will act.
That requires three decisions to work together:
Pricing must reflect the current, relevant micro-market, including competing Active inventory—not simply recent closed sales.
Presentation must create immediate Buyer preference. This is where the House of BCP approach to preparation, furnishing and visual presentation becomes particularly important in a 'higher inventory, more Buyer options to consider' market.
Seller strategy must account for time. The first 2–3 weeks have disproportionate strategic value because a House that moves into the extended market faces a larger competitive set and a different Buyer psychology. However, planning should consider that in this market environment a House could remain Active longer than the House quality, presentation, and pricing would normally indicate. With this potential comes the need to assess that time on market may not be due to a pricing, presentation, or positioning issue, but reflect the nature of the current market environment with a longer Buyer decision process.
The market can still produce strong Seller outcomes. But as inventory builds, the margin for error in initial positioning becomes smaller.
What Should We Watch in September?
September should provide an important test and clarification of the Inventory Build Spiral thesis.
These are the data and questions I will be watching most closely over the next several weeks:
The first question is inventory. Northern Virginia normally experiences an increase in New Listings after the late-Summer slowdown. If that seasonal increase occurs while a substantial amount of July and August inventory remains Active, Buyers in early September could have an even larger selection of Active Houses to consider, especially if weekly New Contracts do not increase to match the New Listings.
The second question is Buyer allocation. Will Buyers redirect more of their activity toward fresh September inventory, restoring the stronger preference for newly listed Houses seen earlier this year? Or will the recent increase in contract activity among longer Days on Market Houses continue, as possible evidence that Buyers are recognizing the leverage opportunities that exist with such a large number of Houses having longer Days on Market?
The third question is market velocity. If New Contracts remain relatively solid but Under Contract Days on Market and Active inventory (compared to 2025) continue to increase, that would provide still stronger evidence that longer Buyer decision times—not simply weaker demand—are driving the inventory build.
Bottom Line on What This Market Data Means
The Northern Virginia market is not simply experiencing higher inventory. The way Buyers are interacting with that inventory has changed over the past month.
Buyer activity remains stable compared with 2025, but Buyers are taking longer to select Houses and directing an increasing share of their contract activity over the past month toward older listings. At the same time, the number of Houses accumulating in the longer Days on Market segment continues to grow.
That combination provides increasing support for the Inventory Build Spiral concept introduced in the mid-July 2026 Northern Virginia Real Estate Market Update.
Whether that spiral strengthens or begins to unwind will depend heavily on what happens when September's expected New Listings enter the market.
For Sellers considering a Fall move, this makes micro-market analysis, initial pricing, and House of BCP presentation increasingly important as part of Listing strategy before the House reaches the market.
Recommended Reading
For additional analysis of the Northern Virginia real estate market and the trends discussed in this Market Update:
Mid-July 2026 Northern Virginia Real Estate Market Update. See the earlier analysis that introduced the Inventory Build Spiral and examined how longer Buyer decision times can contribute to rising Active inventory.
Northern Virginia Strategic Insight Report | Volume 2 : The 2–3 Week Market Tipping Point. Explore why the first few weeks on market have become an increasingly important dividing line between newly listed Houses and the growing extended-market inventory.
Northern Virginia Strategic Insight Report | Volume 1 | Are Buyer Decision Cycles Lengthening? Explore the question whether longer Days on Market are always evidence of a pricing problem—or are they increasingly reflecting changing Buyer behavior in a market with more inventory and less urgency?
Frequently Asked Questions
Is the Northern Virginia real estate market slowing down?
Buyer activity itself has remained relatively solid, with Fairfax County New Contracts closely tracking 2025 since June. What has changed significantly since early June is that Buyers are taking longer to select Houses, while Active inventory and Days on Market have increased.
Why is Northern Virginia housing inventory increasing?
Several factors are contributing. New Listings have exceeded New Contracts for 25 consecutive weeks, but the Days on Market data also indicates that more Houses are remaining Active longer. When Buyers take more time to choose among increasing options, inventory can accumulate even without a substantial decline in Buyer activity.
What is the Inventory Build Spiral?
The Inventory Build Spiral describes a potential self-reinforcing market cycle: Buyers take longer to select a House, causing Houses to remain Active longer. That creates more inventory and more choices for Buyers, which can further reduce urgency, extend decision times, and cause additional inventory to accumulate.
Are Buyers purchasing Houses with longer Days on Market?
Increasingly, yes, at least during the last month. In Fairfax County, the share of weekly New Contracts involving 30+-day Houses increased from 17% during July 8–14 to 33% during August 12–18. However, 30+-day Houses represent a substantially larger share of Active inventory at 56% of total Active Houses, so there is still an imbalance in Buyer activity compared to Active House inventory.
Why are the first 2–3 weeks important for Northern Virginia Sellers?
Buyer activity is still focused more on newer inventory. Once a House moves beyond its first 2-3 weeks, it enters a much larger pool of competing extended time on market inventory. That makes initial pricing, preparation, and visual presentation particularly important.
What should Sellers watch in the Northern Virginia market this Fall?
September New Listings, the distribution of Buyer activity between newly listed Houses and longer Days on Market Houses, and Under Contract Days on Market data will be particularly important. Together, these indicators should show whether the current inventory build continues or begins to moderate.


Comments