Northern Virginia Housing Market Update | High Inventory, Low Buyer Activity, and the Opportunity Window for Buyers | October 29, 2026

Fairfax County & Northern Virginia Housing Market Update | October 29, 2026
Northern Virginia enters the final months of 2026 with a housing market characterized by elevated inventory, longer Days on Market, and fewer Buyers entering Contracts compared with last year. This post provides a late October Market Update on these key market pressures, along with what to what for in November.
The central issue is not simply that more Houses are available for sale. New Contract activity remains too low to materially reduce the accumulated inventory.
This distinction matters. Even as fewer New Listings enter the market during the fall, Active Inventory can remain elevated when the number of Houses going Under Contract is insufficient to absorb the available supply.
The latest Bright MLS data illustrate how these conditions are developing across Fairfax County and Northern Virginia—and why November may present an important opportunity for Buyers and a strategic challenge for Sellers.
1. Fairfax County: Inventory Remains Near Its 2026 High as New Contracts Decline

For the week ending October 25, Fairfax County recorded:
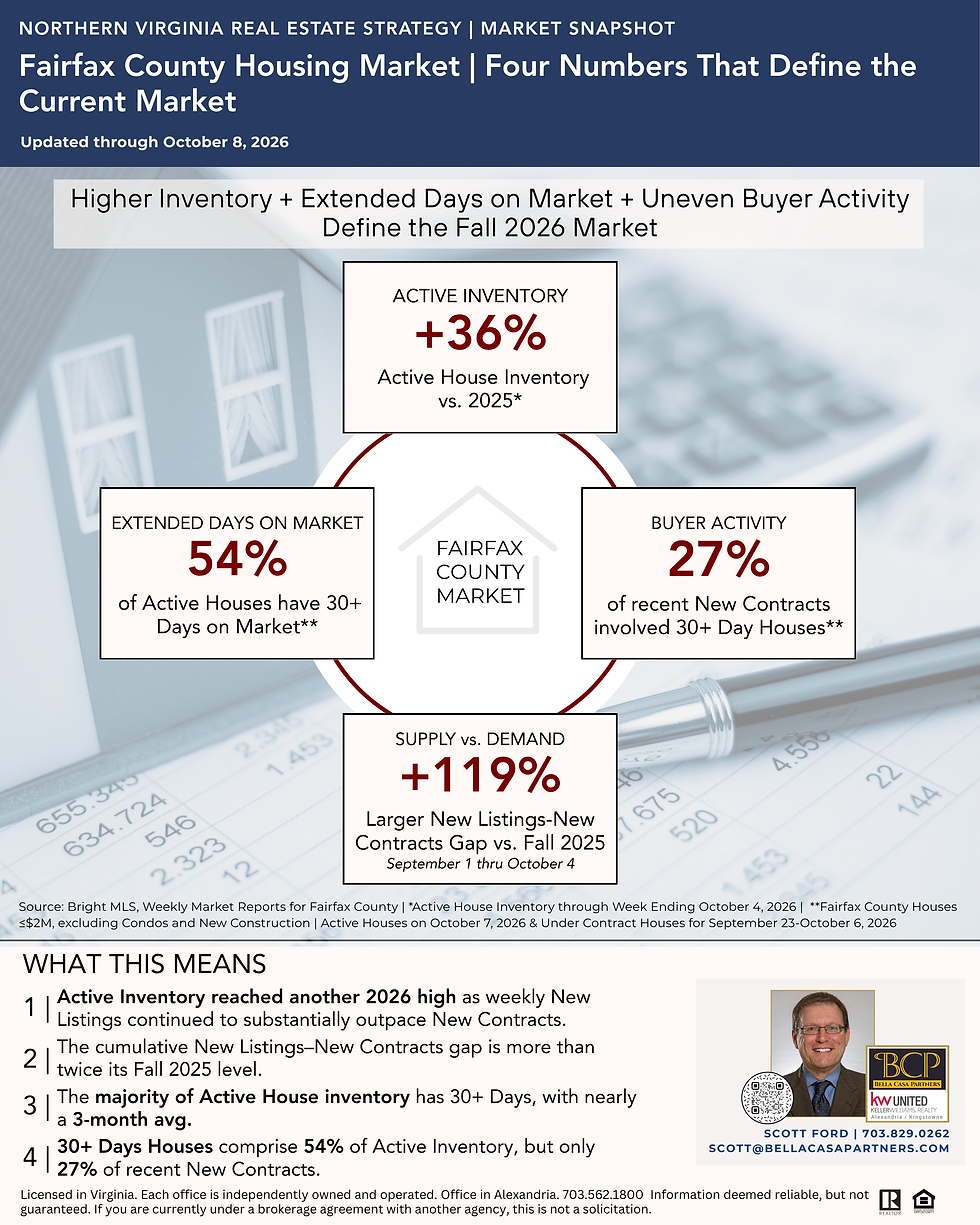
2,228 Active Houses, an increase of 38% compared with the same week in October 2025.
203 New Listings during the latest week.
174 New Contracts, which is essentially unchanged from the prior week. This level of weekly Contract activity is at a low point since tracking began in March.
35 consecutive weeks in which New Listings exceeded New Contracts.
Active Inventory has remained near its 2026 high despite a seasonal decline in New Listings.
For context, Fairfax County has not experienced this level of inventory since May–June 2019, when annual Contract activity was approximately 40% higher than in recent years (2023–2026). To quantify the different, Fairfax County had approximately 4500 more annual Contracts the last time the market had this much Active inventory.
The more significant development is the sustained weakness in Buyer Contract activity.
From September 1 through October 25, Fairfax County has recorded approximately 18% fewer New Contracts than during the comparable period in 2025, while New Listings have increased by only about 1%.
Over that period, the cumulative difference between New Listings and New Contracts reached 700 Houses—more than twice the comparable 2025 differential.
These figures indicate that the widening gap between available supply and Buyer activity is being driven primarily by fewer New Contracts, rather than an increase in newly listed Houses.
The cumulative New Listings–New Contracts difference is a measure of market activity, not a complete accounting of changes in Active Inventory. Other listing-status changes also affect inventory, such as expired/cancelled listings or Sellers withdrawing their House from Active status with the intention to relist in early 2027.
The key market question for November is whether Buyer activity will increase in response to current factors that favor Buyers. If so, will an increase be large enough to have a material effect on the accumulated supply.
2. Elevated Inventory Is a Northern Virginia Market Condition

The inventory increase is not confined to Fairfax County.
For the week ending October 25, six Northern Virginia localities collectively recorded 5,807 Active properties—1,604 more than during the comparable week in October 2025.
Locality | Active Inventory | Change vs. 2025 |
Fairfax County | 2,228 | +38% |
Alexandria | 507 | +49% |
Arlington | 582 | +22% |
Loudoun County | 957 | +48% |
Prince William County | 1,004 | +43% |
Stafford County | 529 | +23% |
Combined | 5,807 | +38% |
Source: Bright MLS, Weekly Market Report for Week Ending October 25, 2026. Data is for all property types and price points.
The increases range from 22% in Arlington to 49% in Alexandria, demonstrating that substantially greater inventory is a broad regional condition.
However, regional inventory statistics do not mean that every neighborhood, property type, or price range has the same supply-demand balance.
For Sellers, this is where micro-market analysis becomes essential. A well-positioned, well-presented House in a desirable neighborhood may face very different competition from a House with comparable specifications in a market segment with numerous similar alternatives.
The regional data establish the broader market environment. Individual listing strategy must be developed from the relevant competitive inventory and recent Buyer activity.
3. Longer Days on Market Reflect the Accumulated Inventory

The consequences of elevated inventory and reduced Buyer activity are evident in the Days on Market numbers.
As of October 28, among 1,135 Active Fairfax County Houses in the tracked market segment (Houses ≤$2M, excluding condos and new construction):
74% had accumulated 21 or more Days on Market, averaging 74 days.
61% had accumulated 30 or more Days on Market, averaging 85 days.
35% had accumulated 60 or more Days on Market, averaging 115 days.
Only 21% had 14 or fewer Days on Market.
These statistics illustrate the depth of accumulated inventory.
A substantial majority of Active Houses have been available for nearly three months. More than one-third of these Active Houses have an average of found months time on market.
Longer Days on Market do not automatically establish that a particular House is overpriced or that its Seller is prepared to negotiate. Property condition, presentation, location, pricing, and the competitive environment must be evaluated individually. However, as discussed later in this post, high inventory of competing options with long days on market is a market environment that creates leverage for Buyers.
4. Extended Market Exposure Is Also Evident Across Northern Virginia

The Days on Market numbers for the broader Northern Virginia market reveals a remarkably similar distribution as in Fairfax County.
As of October 28, among 1,461 Active Houses in Fairfax and Arlington Counties and the Cities of Alexandria, Falls Church, and Fairfax:
75% had accumulated 21 or more Days on Market.
61% had accumulated 30 or more Days on Market, with nearly a three month average time on market.
35% had accumulated 60 or more Days on Market, with nearly a four months average.
The Days on Market numbers are for Houses ≤$2 million, excluding condos and new construction.
The consistency between the Fairfax County and the broader Northern Virginia market reinforces an important conclusion: extended market exposure is not an isolated local phenomenon.
The inventory statistics establish the scale of available supply. The Days on Market statistics demonstrate how much of the tracked inventory has remained available for an extended period.
Neither statistic, standing alone, establishes how quickly - or not - that inventory will be absorbed. Buyer activity numbers reveal whether the current high inventory numbers is likely to change, especially as weekly New Listings decrease as we moved through October into November.
5. More New Contracts Involve Longer Days on Market Houses—but Overall Volume Remains Low

One notable development in October is the changing composition of Houses obtaining Contracts.
During October 21–27, Fairfax County recorded 123 New Contracts in the tracked segment.
Of those Contracts:
47% involved Houses with 30 or more Days on Market.
37% involved Houses with 14 or fewer Days on Market.
Just two weeks earlier, during October 7–13, the corresponding shares were 29% and 59%.
This represents a significant shift in the composition of New Contracts toward Houses with longer market exposure.
However, a higher percentage of New Contracts involving longer Days on Market Houses does not necessarily mean that overall Buyer demand is strengthening.
The distinction between the share of New Contracts and the number of New Contracts is important.
For example, 58 of the 123 New Contracts during October 21–27 involved Houses with 30+ Days on Market.
By comparison, the October 28 Active Inventory snapshot included 683 Fairfax County Houses with 30+ Days on Market.
Without an increase in weekly Buyer activity measured by New Contracts, it would take almost 4 months for the current Active inventory of 30+ Days Houses in Fairfax County to be absorbed (assuming no additional New Listings or cancelled, expired, or withdrawn Listings).
Although these figures involve different measurement periods and are not a formal absorption-rate calculation, they illustrate the relative scale of the accumulated inventory compared with recent Contract activity.
The increasing share of longer Days on Market Houses obtaining Contracts is encouraging for Sellers whose properties have remained on market for 2-4 months.
However, without an increase in overall Contract volume, that shift alone will not materially reduce the current elevated inventory level.
6. November: Could the Buyer Opportunity Window Change Historical Patterns?
The next question is what happens as Northern Virginia enters November.
Historically, New Contract activity declines as November progresses.
My recently published Strategic Insight Report, Volume 4—The Late 2026 Buyer Opportunity Window examined historical Fairfax County Contract patterns and the possibility that current market conditions could influence Buyer and Seller decisions differently this year.
The historical pattern provides a useful baseline:
New Contract activity during the first half of November has averaged approximately 90% of the activity recorded during the second half of October.
Activity during the second half of November has historically declined approximately another 17% from the first half of November.
First half of December Contract Activity is approximately the same as the second half of November, with the second half of December showing a significant drop.
If those historical patterns continue, Buyer Contract activity could decline further from the current level, which would likely put addtional upward pressure on the Active inventory level (unless we have a significant number of expired, cancelled, or withdrawn Listings in November).
However, the current market also presents conditions that may encourage some Buyers to act before year-end.
The Buyer Opportunity Window.
Greater House selection. Buyers have more alternatives than during the tighter inventory conditions of recent years.
Less competition. Lower overall Contract activity may reduce competitive pressure for certain Houses.
Potential Seller flexibility. Some Sellers with extended market exposure or year-end timing considerations may be more receptive to pricing discussions, closing-cost assistance, or other negotiated terms.
There is also an important distinction between a Buyer recognizing an opportunity and actually entering a Contract.
The November question is whether enough Buyers respond to these conditions to produce a measurable increase in New Contract activity relative to historical seasonal expectations.
That is a possibility worth monitoring, rather than an outcome that can presently be assumed.
Read the full analysis of the current Buyer Opportunity Window at: BCP Strategic Insight Report, Volume 4 — The Late 2026 Buyer Opportunity Window
7. What These Conditions Mean for Sellers
For Sellers considering a listing during the final months of 2026—or preparing for early 2027 when we may have a high level of Active inventory as a carryover from Fall/Winter 2026—the data reinforce the importance of a disciplined listing strategy.
A House does not compete against regional inventory statistics. It competes against the specific Houses a prospective Buyer considers reasonable alternatives.
That requires a micro-market analysis addressing current competing Houses, recent Contract activity level, property condition, presentation, pricing, and the likely Buyer audience.
The objective should be to establish a compelling market position at the time of listing, rather than assume that Buyers will respond simply because the House is available.
The House of BCP approach emphasizes preparation and high-impact visual presentation to reduce distractions, improve the Buyer experience, and strengthen perceived value relative to competing Houses.
In a market with substantial inventory, these factors become more consequential—not less.
For Houses already on the market, extended Days on Market should prompt a structured reassessment of the competitive environment, Buyer feedback, pricing, and presentation.
A price reduction may be appropriate in some circumstances, but the decision should follow an assessment of the specific obstacles preventing Buyer engagement and whether a price reduction is likely to be effective in the current low Buyer activity market environment.
8. What These Conditions Mean for Buyers
For Buyers, the current market offers a more favorable negotiating environment from the conditions experienced during periods of tighter inventory. In addition to high inventory with longer days on market and a lesser amount of Buyer activity (both showings and offer interest), Sellers have the additional concern about the Seasonal effect of the November/December Holiday period negatively affecting Buyer activity. These converging market pressures can drive Seller urgency and flexibility, which creates the Buyer Opportunity Window where Buyers have negotiating leverage to apply against Sellers. This window will change to some degree in early 2027, as the Seasonal effect is removed and as more Buyers are likely to be actively looking for a House compared to the current level of Buyer activity.
Greater selection can provide more opportunities to identify a preferred House without the same degree of competition.
Longer market exposure may also create opportunities to negotiate on price, closing costs, repairs, financing-related concessions, or transaction timing.
But longer Days on Market does not, by itself, establish a bargain, nor does Buyer negotiating leverage mean that you can obtain terms that the Buyer views as favorable to proceed with a Contract.
The relevant questions are whether the House is appropriately priced relative to comparable properties, whether its condition supports the asking price, and how motivated the Seller may be to negotiate.
Buyers who have been waiting for greater selection or negotiating flexibility may find the final months of 2026 worth examining carefully.
That opportunity should be evaluated House by House, using current micro-market evidence rather than assumptions about Seller motivation.
9. The Market Indicator to Watch: New Contract Activity
As October ends, Northern Virginia's market conditions are clear:
Inventory is substantially higher than last year.
A large share of Active Houses has accumulated extended Days on Market.
New Contract activity remains insufficient to materially reduce that supply.
The recent increase in the percentage of New Contracts involving longer Days on Market Houses is a meaningful development, does not indicate a change in the low level of Buyer demand.
The most important indicator to monitor during November will be whether overall weekly New Contract activity improves relative to historical Seasonal trends. And, if so, is the increase substantial enough to make a difference in the total Active inventory level.
For Sellers, the practical response is disciplined pricing, preparation, and positioning within the relevant micro-market, along with understanding what is - and is not - occuring within the relevant market segment with respect to Buyer activity and competing Houses.
For Buyers, the opportunity is to evaluate the greater selection and potential negotiating flexibility currently available—before assuming that these conditions will necessarily continue into 2027.
At Bella Casa Partners, we use detailed Northern Virginia micro-market analysis, strategic listing preparation, and informed negotiation to help Sellers and Buyers make decisions based on the market they are actually facing—not generalized assumptions about what might be occurring in the market or hope for what might occur.
Data sources: Bright MLS, October 2026. Inventory comparisons and Days on Market analyses use the specific reporting periods, geographic areas, and property segments identified above.
Recommended Reading
For additional analysis of the Northern Virginia real estate market and the trends discussed in this Market Update:
Northern Virginia Strategic Insight Report | Volume 4: The Late 2026 Buyer Opportunity Window. An examination of how elevated inventory, reduced Buyer competition, and potential Seller negotiating flexibility may create opportunities for Buyers during the final months of 2026, including historical November Contract activity patterns.
September 2026 Northern Virginia Real Estate Market Update. A broader monthly examination of the inventory and Buyer activity trends developing during September, providing context for the latest weekly data and where the market trends are heading into October.
Northern Virginia Strategic Insight Report | Volume 3: Buyer Preference Gap and Inventory Build Spiral. An analysis of how the relationship between Buyer preferences, available inventory, and listing competition can contribute to longer Days on Market and accumulating supply.
Explore additional Northern Virginia Real Estate Market Updates and Strategic Insight Reports at BellaCasaPartners.com/marketnews.
Frequently Asked Questions
Why is Northern Virginia housing inventory so high in October 2026?
Northern Virginia inventory remains elevated primarily because New Contract activity has not kept pace with available supply. In Fairfax County, New Contracts during September 1 through October 25 declined 18% compared with the same period in 2025, while New Listings increased only about 1%. The resulting supply-demand imbalance has contributed to substantially higher Active Inventory.
How long are Houses staying on the market in Fairfax County?
As of October 28, 2026, 61% of Active Fairfax County Houses (≤$2M, excluding condos and new construction) had accumulated 30+ Days on Market, with these Houses averaging 85 Days. 35% of Active Houses had 60+ Days, averaging 115 Days. Actual market exposure varies by neighborhood, price range, property condition, and listing strategy.
Are Buyers purchasing Houses that have been on the market longer?
Yes. During October 21–27, 2026, 47% of New Contracts in the tracked Fairfax County segment involved Houses with 30 or more Days on Market, compared with 37% involving Houses with 14 or fewer days. However, overall Contract volume remains low, so this shift does not necessarily indicate stronger Buyer demand across the market.
Is November 2026 a good time to buy a House in Northern Virginia?
In general, Buyers currently have an Opportunity Window with greater negotiating leverage than in recent years. November may offer opportunities for Buyers because inventory is elevated, Days on Market are longer, competition is lower in most market segments, and certain Sellers may have greater negotiating flexibility due to these factors and the concern about the historical seasonal decline in Buyer Contract activity. However, favorable terms are not guaranteed. Buyers should evaluate the specific House, comparable sales, competing inventory, and Seller circumstances before deciding whether an opportunity exists.
Should Sellers reduce their asking price when Days on Market increase?
Not automatically. Longer Days on Market should prompt a reassessment of pricing, property presentation, Buyer feedback, and competing Houses. A price adjustment may be appropriate when the evidence indicates that the current market position is not generating sufficient interest. The decision should be based on a micro-market analysis rather than an arbitrary Days on Market threshold, as a price reduction may not change how Buyers react to a House in the current lower Buyer activity market environment with a high number of competing options for a Buyer to consider.


Comments