An Early May 2025 NoVA Market Update | A Deep Dive into New Listings vs. New Contracts Trend & Increasing Days on Market | Northern Virginia Real Estate Market
- Scott Ford

- May 8, 2025
- 6 min read
Updated: May 12, 2025
How's the NoVA real estate market in early May? How has it changed from my last deep dive NoVa market update in my April 24th Market Update Post?
For all my deep dive market analysis & monthly updates on the NoVA real estate market, including West End Alexandria & Kingstowne areas, check out bellacasapartners.com/marketnews.
Let's take a look at three different, but related, types of market data to assess where the market is as we start May. And where it may be over the next 2-4 weeks.
First, what does weekly data for the week ending May 4th show for the Northern Virginia Real Estate market, using the new data source provided by Bright MLS.
Then we look at the 2-week tracking data for New Contracts in Fairfax County, updated through the April 16-30 period.
The last market data discussed is a deep dive into Days on Market (DOM) numbers for the Washington DC Metro area and NoVA market. Spoiler: The "true" DOM is higher than what would be suggested by the Overall Average and Median DOM.
My assessment of what this data means for the NoVA real estate market is at the end of this Post.
Now for the Charts.
1. New Listings continue to be higher than New Contracts for the Week Ending May 4th. Showing traffic was the 2nd highest total in 2024, but slightly trailed the same week in 2024. Approximately 25% of Fairfax County Active Listings have a price drop in each rolling three week period over the past 2+ months.
In late-February, Bright MLS started a weekly market update for the Greater DC Area, with data on New Listings, New Contracts, and Showings. The last data point is notable as it is the first time agents have weekly data on Showings to analyze as another indicator of Buyer activity and trends over time. Prior to this new weekly update, Showing data was only available as a monthly total.
Sadly - although not surprising for my profession - most agents will not be aware of weekly market update. Even fewer will take to time to assess what this data may mean for their current and future clients.
I focus on the data for Fairfax County as a barometer of the overall NoVA market. I created these charts to show week-to-week trends, along with a comparison to the corresponding 2024 week. Also, since a % increase amount for New Listings can be misleading, I quantify the % increase to show how many properties are represented by the increase.
The weekly data is provided for various localities (e.g., Fairfax, Arlington, Loudoun, Prince William, & Stafford Counties, the City of Alexandria, etc.). Although the weekly data does not account for property types, price points, and other elements that affect market activity, this data is a useful resource for trend analysis to assess what the market might be like over the next 4-6 weeks.
New Listings continue to exceed New Contracts, which continues the weekly trend starting in late-February. The spread between New Listings and New Contracts in Fairfax County narrowed from the substantial gap for the week ending April 27th. However, the New Listings > New Contracts trend continued. As I have been saying for weeks, this ongoing negative ratio will continue to increase inventory, as it is coupled with houses taking longer to go under contract.
The Days on Market charts in the last Section of this Post shows this market reality in stark detail.
The 1st chart shows the weekly trend of New Listings vs. New Contracts in Fairfax County since the start of March. The 2nd chart shows the New Listings vs. New Contracts spread for the higher volume localities for the week ending May 4th. New Listings were up across all localities versus 2024, with New Contracts either flat or running behind the same week in 2024.
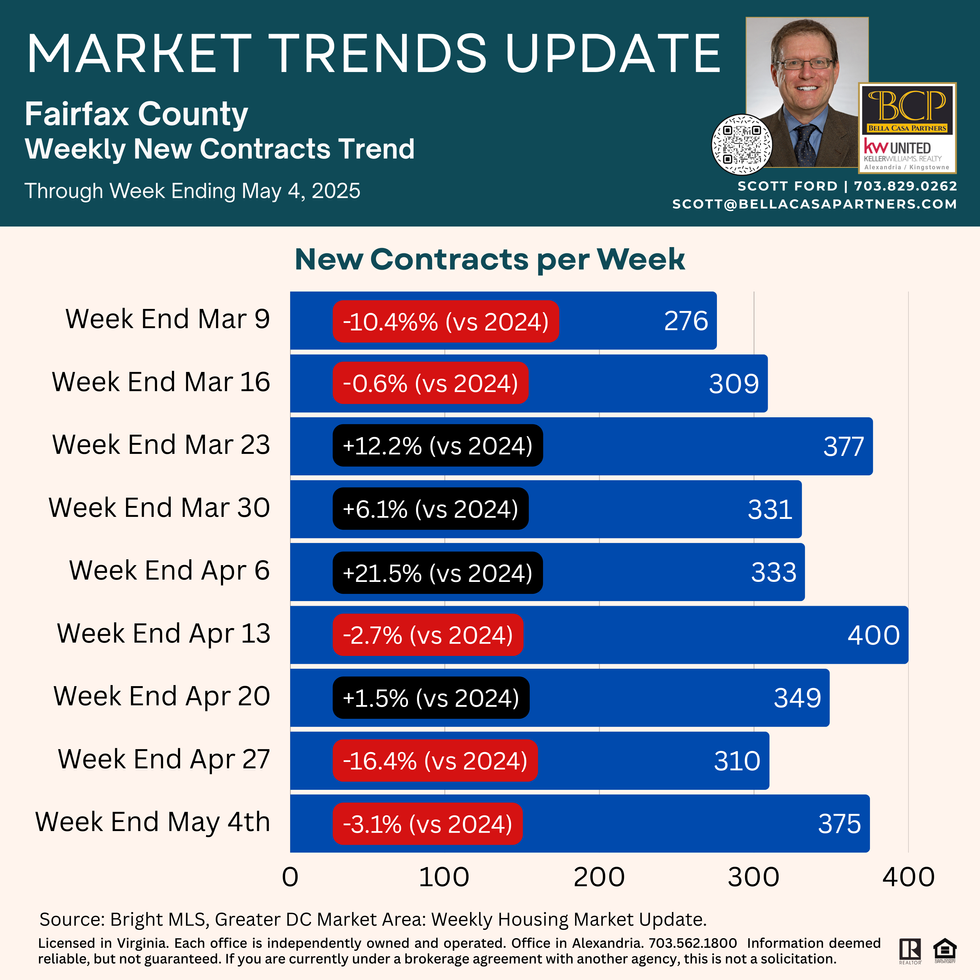
The 3rd and 4th charts show the weekly data for New Listings (+10.2% for week ending May 4th vs. 2024) and New Contracts (-3.1% for week ending May 4th vs. 2024).


Showings for the week ending May 4th were 2nd highest total this Spring, but down slightly (-2.4%) from 2024.

25% of Fairfax County Listings have a Price Reduction every three week rolling period. I created a new chart which shows the weekly % of Listings in Fairfax County that had a price drop.
This data suggests that for every three week period, approximately 25% of Listings will have a price drop. It is reasonable to presume that New Listings each week will likely not have a price reduction within the first three weeks. This data therefore indicates that a sizeable number of houses have longer than three weeks on market during each rolling three week period. The DOM charts in the below Section show this reality of our overall market regarding DOM.

2. New Contracts in Fairfax County for the 2nd Half of April trailed the same period in 2023 & 2024. The significant increase in New Contracts for the 2nd Half of March was not the start of a trend.
The Bright data shows 599 New Contracts in Fairfax County during the April 16-30 period. The April 16-30 Contracts trail the same period in 2023 and 2024 by approximately 10%, which translates to 65-69 fewer contracts. The first half of April Contracts were flat to 2024 (679 vs. 681).
The significant increase in Contracts during 2nd half of March was not the start of a trend.
Plenty of Buyers are putting houses under contract (i.e., 2025 Contracts numbers are generally in line with 2024). But higher days on market and more inventory are present due to the cumulative effect of more New Listings than New Contracts during March and April. The current data seems to indicate this trend is likely to continue (& perhaps increase if the New Listings vs. New Contract numbers across the “high volume” localities do not revert to the range for the prior weeks).

· 2. The Days on Market (DOM) numbers are rising. What I call the “true” DOM data is far higher than simply looking at the overall Average DOM/Median DOM numbers.
The three charts below show DOM for the noted localities. First, the “high volume” Northern Virginia localities. Second are the close in DC Metro localities. The charts show the overall Average & Median DOM for each locality, followed by the Average & Median DOM for those Active Listings with DOM greater than the Overall Median DOM.
The second category is much higher than the first. The Overall Median number is misleading if taken at face value. For Fairfax County, the Overall Median is 15 days, with Overall Average at 30 days. However, since 50% of Active Listings have fewer than 15 DOM, the 50% of Active Listings will have far more than 30 DOM in order to produce an Overall Average of 30 days.
For Fairfax County, the Average DOM for Active Listings with more than 15 DOM is 52 days.
Think about that. Active Listings in Fairfax County as of May 6th that are on market for just over two weeks have an Average DOM of almost 2 months.
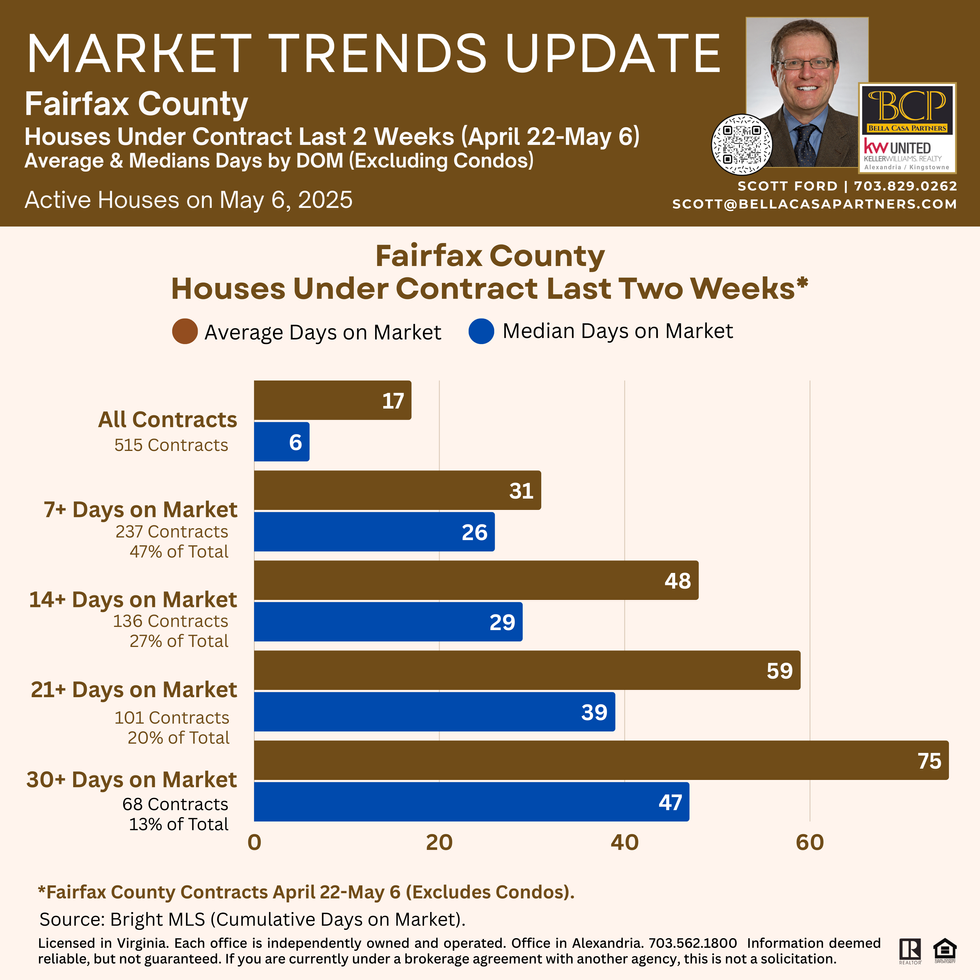
The third chart shows the Average & Median DOM for Listings that went under contract during the last two weeks (April 22-May 6), as of when I calculated yesterday. I calculated these numbers for the total number of Contracts, then for Contracts with 7+, 14+, 21+, and 30+ days on market at time of contract.


So, What does all this data mean for our current NoVA market?
The following is my market assessment looking at the data and from watching Buyer activity in the TH micro-market that I continually track ($800K-$1.2M Inside Beltway to 5 miles outside) over the February through early May period.
The overall market is not awful. Total contracts are flat to only slightly behind 2024 (probably 5-10% less depending on locality and time period). New Listings are up each week, so there is more inventory due to the negative New Listings-New Contracts ratio. Inventory is also up due to houses taking longer to go under contract, as shown in the charts below. Showing traffic has lagged 2024 numbers (especially when you account for the Spring Break/Easter weeks & following week in 2024 and 2025). However, the lag does not appear to be such a low number as to be an “unhealthy” or stagnant market.
Some of the houses with long(er) DOM are in that position due to a lesser quality house, poor presentation, and/or being overpriced due to the former factors & objective sales data. However, the sheer number of houses that have long(er) DOM that continues to pull up the Overall Average & Median DOM means there is a sizeable subset that are taking longer to sell due to external factors, i.e., Buyer Psychology – Buyer Uncertainty – Lesser Buyer Activity Level). A lower price point may/may not change the dynamic with Buyers (excluding a lower price point that brings in a different Buyer cohort and/or becomes a “steal”/below proper value for the community). If the Seller’s circumstances allow, waiting for a buyer to emerge, then negotiating from a solid price point for a quality house may be the right course of action.
3. Some market segments continue to be robust due to house type, price point/affordability, location, and other factors. Others market segments are seeing slower activity (i.e., lower level of Showings/New Contracts and/or Showings with Buyers not making offers on any house). For me, knowledge about the competing house inventory level and weekly contract rates within a market segment that is relevant to a client’s house has paramount importance as/if inventory and DOM continues to rise.


Comments