Mid-March 2026 Northern Virginia Real Estate Market Update | 2026 Looks Similar to 2025 as We Near Start of the 'Peak' Spring Market
- Scott Ford

- Mar 21
- 5 min read
Updated: Apr 1
How is the Northern Virginia real estate market in mid-March 2026?
What does the current Market data tell us as we near the start of the 'Peak' 2026 Spring Market, which runs from late-March through May?
Let's get the answers through a deep dive look at the Buyer Activity Level measured by New Contracts, Days on Market, and the Inventory of Houses for Sale.
I provide a Market Summary below the Post, but read the full Post for all the details and charts.
Each chart in the Post is also included below for ease of data viewing.


📷 MARKET SNAPSHOT IN MID-MARCH 2026
At the start of 2025, I began tracking New Contracts activity in Fairfax County on a weekly and first half/second half of each month basis, with a comparison to 2024 and 2023 Contract activity. New Listings & Total Active Houses for Sale Inventory are also tracked on a weekly basis. This tracking provides real time insight into the Buyer activity trend, especially when compared to the notable increase in Days on Market (DoM) throughout 2025. As the largest market in NoVA, Fairfax County is a good barometer of the Overall NoVa market.
All data below is for Fairfax County unless the NoVA Market segment is referenced, which is comprised of Fairfax & Arlington Counties and Cities of Alexandria, Fairfax, & Falls Church.
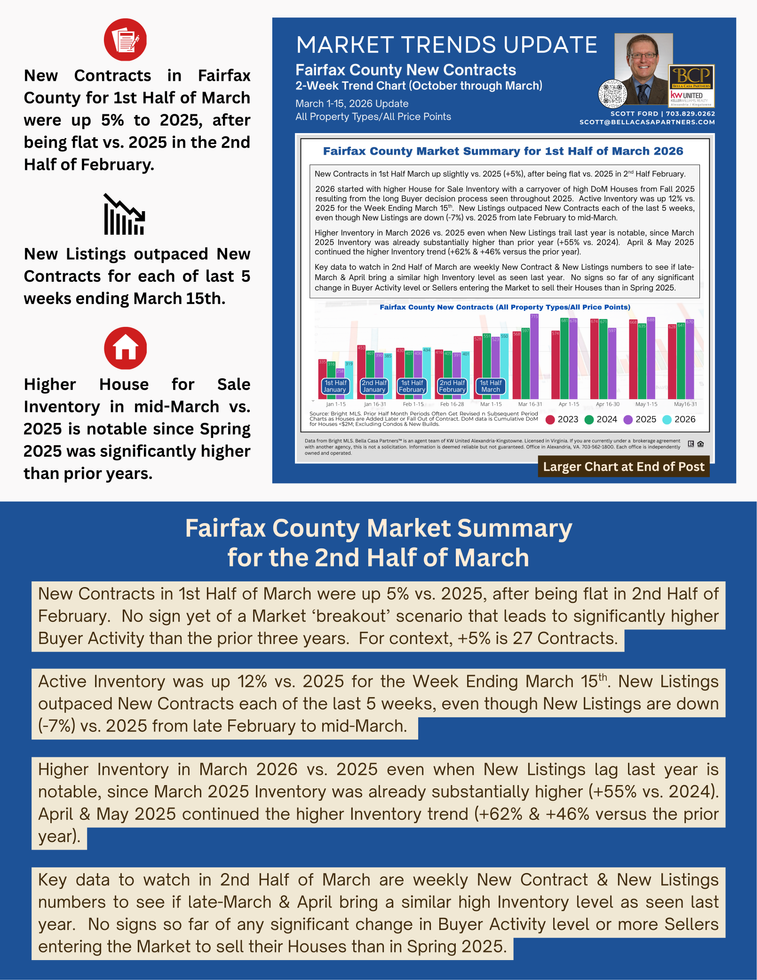
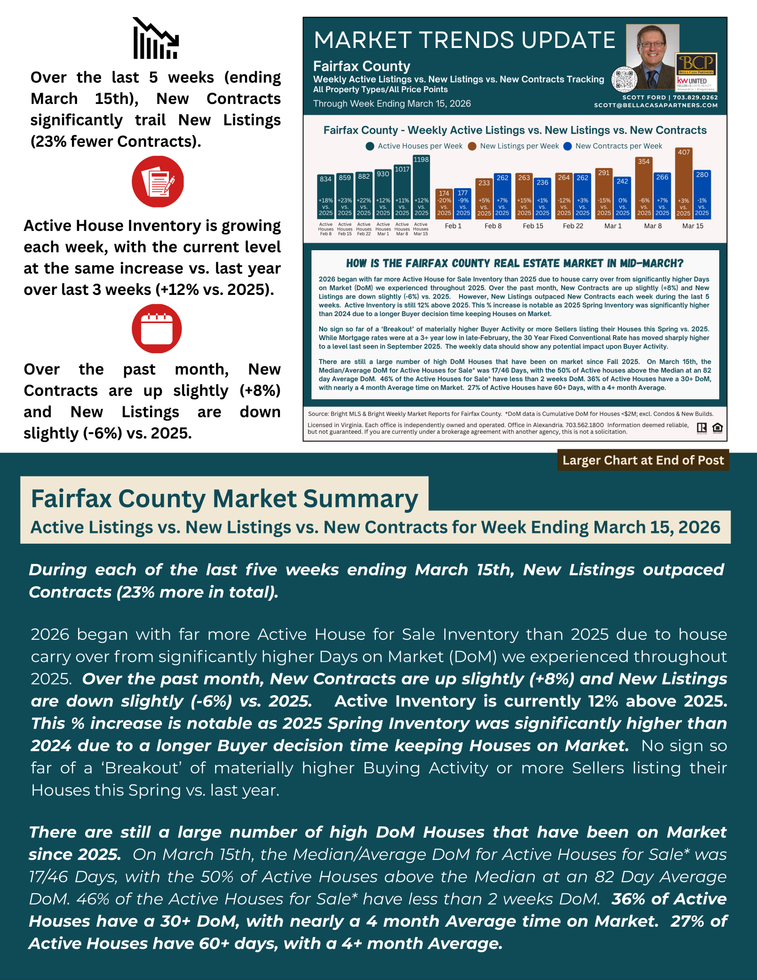
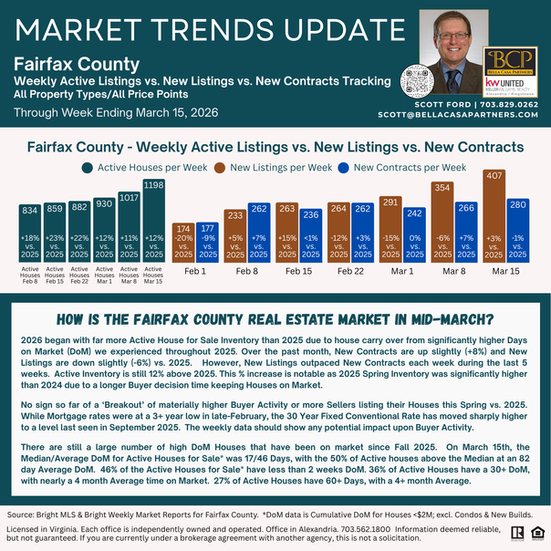
➡️ Higher House for Sale Inventory than 2025, which is notable as 2025 Inventory was significantly higher than 2024. Active House for Sale Inventory in Fairfax County is +12% vs. 2025. Inventory in February, March, and April 2025 was already at a high level with 24%, 55%, and 62% increases vs. the prior year. New Listings outpaced New Contracts each of the last 5 weeks (Ending March 15th), even though New Listings are down (-7%) vs. 2025 from late February to mid-March.
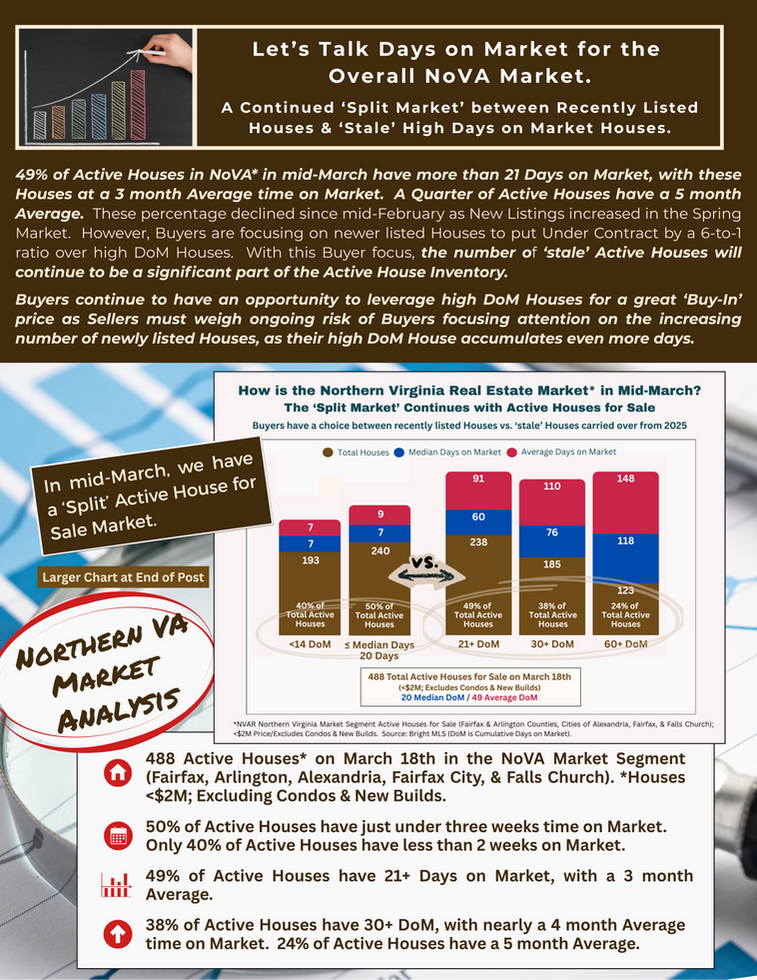
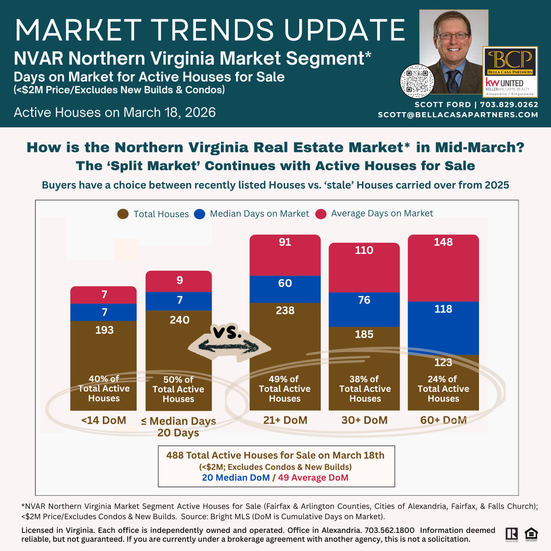
➡️ We have a 'Split' Active House for Sale Market between recently listed Houses & a large % of high DoM Houses that date back to 2025. All Days on Market (DoM) data is for <$2M Houses, Excluding Condos & New Builds.
💠49% of Active Houses for Sale in Fairfax County have 14 Days or less time on Market 40% of Active Houses in the NoVA Market segment have 14 Days or less time on market.
Contrast the recently listed Houses to the high DoM Houses.
💠46% of Active Houses in Fairfax County have 21+ Days, with a 3 month Average. 36% of Active Houses for Sale in Fairfax County have 30+ Days, with nearly a 4 month Average time on Market.
💠49% of Active Houses in the NoVA Market segment have 21+ Days, with a 3 month Average. 24% of Active Houses the the NoVA Market segment have 60+ Days, with a 5 month Average time on Market.
DoM numbers will continue to fall, especially the Median number, as New Listings increase during the peak Spring Market period. However, we will continue to have a significant number of high DoM houses dating from 2025, as Buyer Activity shows an unsurprising preference for newer listed Houses vs. ‘stale’ Houses.
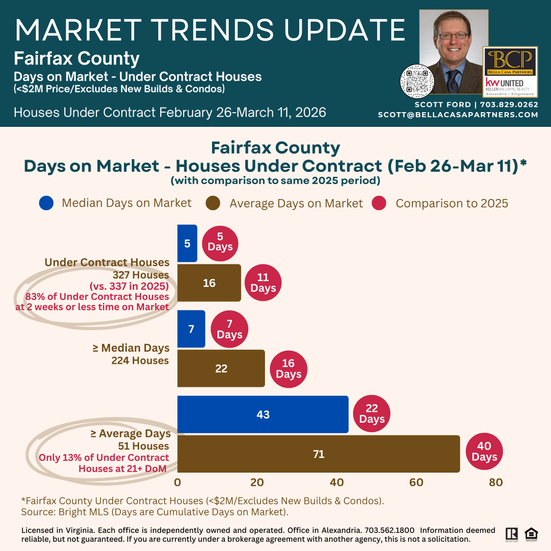
➡️ Buyers are focusing on newly listed Houses, rather than high DoM Houses, by a 6-to-1 margin. 83% of Under Contract Houses in Fairfax County during the 2 weeks ending March 11th had less than 2 weeks on Market. Contrast this number with only 13% of Under Contract Houses have 21+ Days on Market, with a 3 month Average.
The current week (March 12-18) continued the 83% rate. This Buyer focus on newly listed Houses is increasing, as the prior 2 week tracking periods had 71%, then 78%, of Under Contract Houses with less than 2 weeks time on Market.
➡️ Buyer Activity in March (through March 15th) is up slightly vs. 2025, with no signs (so far) of a 'Breakout' scenario for significantly higher Buyer Activity than in 2023-2025. The NoVA Market segment is +6% in New Contracts in 1st Half of March/Fairfax County is +5%. Both % increases are in line with February numbers. For context, 5% more Contracts in Fairfax County during the first half of March equals 27 Contracts, which is not a material increase.
➡️ Buyer opportunity exists to leverage high DoM Houses for a lower ‘Buy-In’ price. Sellers with high DoM Houses need to weigh risk of Buyers focusing on the ever increasing number of newly listed Houses, as their ‘stale’ House lingers with increasing DoM.
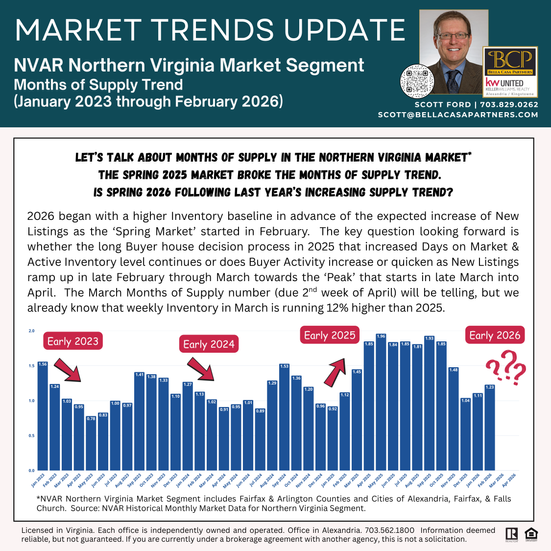
➡️ The Spring 2025 Market Broke the Months of Supply Trend. Does this continue in Spring 2026?
Or to Paraphrase 'The Who'...
Meet the New (2026) Spring Market...Same as the Old (2025) Spring Market?
💠The Months of Supply number typically falls during the peak Spring Market months (March through June), then rises to a yearly Peak in late-Summer into Fall.
💠The 2025 Spring Market broke the trend by increasing the Months of Supply each month. The Supply level stabilized at just under 2 months for the Northern Virginia market from April-October, which was the highest sustained level by far since 2018.
💠2026 started at a much lower Months of Supply number than the 2025 peak, but January & February 2026 had 20% & 10% higher Months of Supply than 2025. The February increase is notable as the 2025 number was already 24% higher than 2024.
💠The March Months of Supply number (due 2nd week of April) will be telling as to whether the 'Peak' Spring Market period is likely to track with 2025. We already know that weekly Inventory in March is running 12% higher than 2025, with weekly New Listings outpacing New Contracts each week over the past 5 weeks ending March 15th.
➡️ Monthly Active House for Sale Inventory was Substantially Higher in Fairfax County for all of 2025 compared to 2024. Does this Continue in Spring 2026?
💠 2025 was a much different Market than Buyers & Sellers faced in 2023 & 2024. Buyers had far more choices due to higher Days on Market leading to more Inventory as Houses stayed on Market longer.
💠 2025 began with a higher baseline of Active Inventory in Fairfax County compared to the last three years, although only slightly higher than 2025 (+15% in January/+9% in February). New Listings & New Contracts are at their peak in late-March through May. The March number should provide a sign whether the Active Inventory level will be similar to 2025 or a quicker Buyer decision process vs. last year will hold Spring Market Inventory to levels seen in 2023 & 2024.
📊WHAT IS THE KEY DATA TO WATCH IN LATE MARCH/EARLY APRIL?
🌟 Weekly New Contracts & New Listings Numbers. Look for signs of increased Buyer Activity & whether the Buyer decision process shortens from 2025 in response to ‘Spring Buying Market’ psychology. Also watch if Buyer Activity is impacted by the sharp rise in Mortgage Rates from the 3+ Year low point in late February (currently at Sept 2025 level on March 20th).
🌟 Weekly Active House Inventory. Does Active House Inventory return to the prior Historical trend of falling during Spring Market even as New Listings increase in the ‘Peak’ period that starts in late March versus Inventory increasing each month as in Spring 2025. In mid-March, the 2026 data looks similar to the 2025 Market.
🤔🙋🏼♂️ WANT TO SEE MORE MARKET ANALYSIS? See more market news, insight, & analysis on my "How's the Market?" Blog at bellacasapartners.com/marketnews.


Comments